Towards better elections
Report on Democracy Club’s work on the May 2016 elections and the future of digital services for democracy
Elections took place across the UK in May 2016: the most varied set of elections seen here for decades. Everyone had a vote in at least one election.
Democracy Club built tools that allowed anyone in the UK to enter their postcode and discover their local elections and their local candidates. To make this happen, we listed elections, including by-elections, and crowdsourced the details of 13,068 candidates. In addition, for the first time, we also ran a pilot to crowdsource data on the results of elections.
Over 180,000 people used our tools directly (at WhoCanIVoteFor.co.uk) and the data was used by partners to reach many thousands more. We also worked hard to help councils provide data to power a polling station finder, largely focused on Wales, where we achieved coverage for 47% of the electorate.
In the process of building these tools, we discovered the lack of nationwide knowledge as to what elections were happening and where. In order to get a grip on the menagerie of different elections we established an election identifier standard that we urge other institutions to adopt.
We learned that the data needed to power a polling station finder can be difficult for councils to provide, and that there is no national format for that data. On candidates, we learned that there is strong public demand for better information on ‘where they stand’.
While our crowdsourcing achievements were remarkable, and user numbers were impressive, there is still much we could improve. The number of data partners was smaller than hoped, both in terms of media re-use and use by campaigners to engage with candidates.
We must begin crowdsourcing and partnership building earlier, meaning starting now for the May 2017 elections.
We remain convinced of the importance of better digital services for democracy, and believe that elections are the best place to start. Over the next four years, each May will provide a different set of elections to improve, culminating in the 2020 General Election.
Each May, we plan to provide a perfectly accurate lookup tool for every candidate in every election, with the open data used by a range of partners to reach as many people as possible. We want to trial new methods to get information to voters on where their candidates stand on the issues that they care about. We want to vastly increase coverage of our polling station finder. We also want to be able to tell people the results of every election.
Ideally, all of this data will remain open for anyone to use. In the long run, perhaps on a five-to-ten year timeframe, we hope that all the basic data will be provided by the state, whether local or national government, freeing up the time of organisations such as Democracy Club to focus on other user needs.
To continue to provide a credible, accurate and reliable source of data for partners, and to continue to test new digital features for voters, Democracy Club needs to find sustainable funding. We estimate that we require just £250,000 per year for a small agile project team to deliver this. Everyone benefits from better political decision making. We are therefore seeking grant funding from governmental and philanthropic institutions, and we encourage partners who benefit from the data to help us in any way they can.
We predict that demand for digital services for democracy will only increase over the next few years, and that by 2020, a majority of voters will expect to be able to engage with their candidates online before deciding who to vote for. Democracy Club can deliver this: efficiently, inexpensively and — crucially — in a non-partisan and fair fashion. Help us make it happen.
1. Our vision, mission, and an invitation
Our vision is of a society in which democracy thrives through knowledge, participation and openness.

This can only happen if people’s experience of democracy reflects their expectations of 21st century interaction.
Building on our experience of recent elections — this report covers May 2016 in detail — we will test and iterate products and services over the next four years to culminate in the provision of world-leading digital infrastructure for a modern democratic experience at the 2020 General Election. That experience will embrace the best of open data, design and technology to give every voter the information and participation opportunities they need, in a way that suits them.
It is within our means to improve the democratic experience of tens of millions of people in the UK.
We are seeking committed partners to help realise our vision.
Come join us.
Joe Mitchell & Sym Roe
2. Review of May 2016 elections
Summary
Our work is directed by user need
We learned about user need by examining Google searches and tweets on and around polling days. For instance, on the day of the general election last year, every one of the top ten Google searches related to the election. This provides robust evidence that tens of thousands of people are trying to engage in the democratic process and seek more information to do so. The five top Google searches on 7 May 2015 were:
- Who should I vote for?
- Who are my local candidates?
- How do I vote?
- Where do I vote?
- Where is my polling station?
We're focused on candidates and polling stations
We imagine that the ‘how do I vote’ question can be best answered by officials in the polling station, though we aim to provide this information more consistently in future. We choose not to deal with the first, normative, question, partly because it is extremely difficult to do well. Furthermore, it too relies upon the existence of basic data on candidates. Our work creates the infrastructure that enables such tools to exist.
We provided the most accurate and comprehensive database of candidates across every election in the UK on 5 May 2016
We provided an online lookup tool, WhoCanIVoteFor, used by over 180,000 people and trusted by the Electoral Commission to include on their AboutMyVote website. Our database was also used by the LSE’s Democratic Dashboard, and a stripped down version was used to tell Buzzfeed’s readers which elections they could vote in.
Our polling station finder covered 47% of the population of Wales and several councils across England and Scotland
Our polling station tool was included in the WhoCanIVoteFor website and provided as a micro-site for NUS Wales. Our tool was also embedded in one council’s website and linked to by several other councils via their election webpages.

Candidates data
Data quality and coverage
Earlier this year we hoped by the election to have the details of every candidate for the Scottish Parliament, Police and Crime Commissioners, Mayors in Bristol, Liverpool, London and Salford, Assemblies in London, Northern Ireland and Wales. We also estimated that we might pull in a thousand or so of the local candidates. We went much further.
We achieved the best national coverage of candidates ever published before a UK election.
Before polling day, all 13,068 candidates — in what we think was every election in the country — were in the database.
The name and party data was crowdsourced from the official statements and then checked by another sourcer before being ‘locked’, ensuring near perfect accuracy.
There were a few cases of duplicate candidates, for example where the same individual was standing in two distant parts of the country but was recorded by us as two different people, and a small number of errors around ‘non-duplicates’ — where candidates shared the same name and party, but were actually different people. These cases were very rare: perhaps five to ten in 13,000 candidates.
For those 13,068 candidates, the team of volunteers also found 1,637 profile photos, 1,649 email addresses, and 1,766 links to facebook or twitter accounts. Particularly at the local level, this was more information than voters have ever had in one place online before.
We tested an ‘Election Mentions’ tool, which found and linked to interesting news stories relating to candidates. This feature wasn't shown to voters in the end as the false positive rate was too high, i.e. too many false matches were being found involving people with the same or similar names to candidates.
While candidates.democracyclub.org.uk was updated in real time, a lag between that site and the public-facing WhoCanIVoteFor.co.uk meant that on a small number of occasions changes to the candidates data would not be immediately reflected on WhoCanIVoteFor, which occasionally led to complaints from candidates and, in one instance, a council who spotted candidates on WhoCanIVoteFor that had in fact withdrawn. We were able to react to these problems within hours of them being reported.
Usage
We served over 180,000 visitors to WhoCanIVoteFor.co.uk.
In 2015, our similar candidate search site, YourNextMP, received over a million unique visitors. We guesstimated that we would see perhaps 90% less traffic to the equivalent site for 2016, due to the probable lack of interest and media coverage.
This lack of interest and coverage became more apparent over the months in advance of the elections, primarily due to the US presidential primaries and EU referendum stories dominating politics news.
While reflecting the lack of interest in non-general elections, our 2015 numbers also demonstrate the power of our partnership with Google, who in 2015 provided a dedicated search widget using Democracy Club candidates data, which then linked to YourNextMP.
When we approached Google earlier this year we found that they were, and are, entirely focused on the US presidential election in November. Our biggest traffic source in 2016 was the AboutMyVote website provided by the Electoral Commission, who linked to the site on their election pages for Scottish Parliamentary elections and English local elections.
Several partners made use of the data for information, widening our impact.
By making the data open, we hoped that media partners with large audiences would use it to reach many more people than our singular efforts ever could. However, we had considerably fewer partnerships for 2016 than for GE2015.
Two projects stand out. The LSE project Democratic Dashboard used all the candidate data we provided. They achieved wide coverage on an attractive website that included their past election results data. We estimate that they helped the data reach at least another 70,000 people. The popular online content site Buzzfeed used our data on the elections to be able to tell their readers what elections they could vote in. They put this widget at the top of their homepage and, judging from the number of times a request was made to our API, they helped reach 7,500 people.
For 2016, we saw little to no use of the data by campaigners.
Campaign groups are often able to take advantage of this sort of data, for instance to help activists contact candidates to push for a certain policy. We are not aware of the use of our data in this way; this is one downside, amongst many upsides, of making the data open: people and organisations are not required to inform us if they use it, limiting our ability to measure impact.
Assuming we were significantly down on use by campaigners, this was probably due to the time it took us build the database. We suspect that several organisations will have spent time and money building their own closed databases, or simply not been able to run campaigns that required such data. We belive that this is more evidence to suggest that there is value in providing candidates data significantly in advance of the ‘official’ Statements of Persons Nominated published by councils.
Polling station location data
Data quality and coverage
We began the year with the lofty goal of reaching 90% coverage of UK polling station locations. This was wildly optimistic, for reasons explained in the next section.
Due to these reasons, and an approach by NUS Wales, whose student survey had identified a strong user need, we refocused our efforts on Wales and London, where we knew several boroughs would be able to provide data. However, in March, we learned that the Greater London Authority (GLA) would be providing a polling station finder for all 32 boroughs. We then just linked to the GLA’s finder and doubled down our efforts in Wales, along with dedicating time to accommodating any pro-active councils elsewhere that got in touch to supply data.
In total we covered ten councils in Wales, seven in England and one in Scotland (see Annexes). Our coverage in Wales extended to 47% of the Welsh voting-age population.
Data use
We used the polling station data to serve a finder (address and map) on WhoCanIVoteFor.co.uk if we had data for that user’s postcode. Where we did not have polling station data, users were served with a phone number for their council, further down the information hierarchy of the page.
We also created a mini-site for NUS Wales — WhereDoIVote.wales / bleibleidleisio.cymru — which was used by over a thousand people. From 1 May to 5 May, 72.5% of visitors to the dedicated site for Wales were provided with a polling station address, in contrast to the overall results for the UK where the majority of page impressions represented an unsuccessful user journey.
Particularly successful areas in Wales included Neath Port Talbot, where 448 people entered a postcode and 414 found their polling station, and Cardiff, where 969 people entered a postcode and 943 found their polling station. (The small number that didn't find a polling station most probably entered a business/office postcode that didn't correspond to a station.) In both of these areas, we saw nearly 0.5% of the voting-age population use the finder.
Results data
This May we piloted the crowdsourcing of open results data with partners at the Local Government Information Unit (LGiU) and the Open Data Institute.
We made no predictions as to the extent of data we would receive, but in the end a dedicated team at LGiU were able to produce data on council control in near real-time and in some instances quicker than national media outlets. An interactive map created from this data was embedded into the Telegraph online election liveblog on election night and received over 70,000 views.
At a ward level, an army of online volunteers has nearly entered all votes data. Verification of the data against an official council source is likely to be complete by June 2016. This will be the first time that open elections data has existed on such a granular scale. It can be accessed via the results page of candidates.democracyclub.org.uk.
Thanks partially to our efforts, the UK Government has committed to ‘develop a common data standard for reporting election results in the UK faster and more efficiently, and develop a plan to support electoral administrators to voluntarily adopt the standard’. This is commitment #7 in the UK’s National Action Plan as part of the UK’s membership of the Open Government Partnership.
3. The process: how we did it
Finding and identifying elections
There is no national UK record of when elections are happening. While general elections are now predictable due to the Fixed-Term Parliaments Act — and enter the public’s common consciousness through media reporting — local elections are not.
For example, there is no rule of thumb that demonstrates whether a council elects one third of councillors once a year with a fourth year free, or whether they are all elected in one year. It is also hard to predict how many seats are in each ward (typically three, but not always). One of the basic tenets of a representative democracy must surely be that elections are clearly signposted, well in advance of the publishing of a Notice of Election (usually as a poorly accessible PDF on a council websites).
At first we tried to crowdsource the elections with our ‘Every Election’ tool, but before long had awoken a rich seam of election experts who kept their own records and were keen to share. The work of Andrew Teale, in particular, was so good we used it as the base data and built on top.
There were significant issues experienced along the way — most notably, spatial data for recent boundary changes was still not available. This meant we knew that an local authority such as Bristol had elections across all its wards, but we did not know where the wards were. This was only solved at the last minute when boundary data was released.
Lastly, in order for data on candidates and polling stations to be useful, it needs to have a shared reference point: the election. But, since there’s no national record of elections, these have not been given machine (or human) readable identifiers.
To the rescue came Tim Green, who designed a robust system for issuing election identifiers, which we used across the May elections. We suggest all institutions concerned with elections adopt this approach, detailed in an annex to this document.
Building a database of candidates
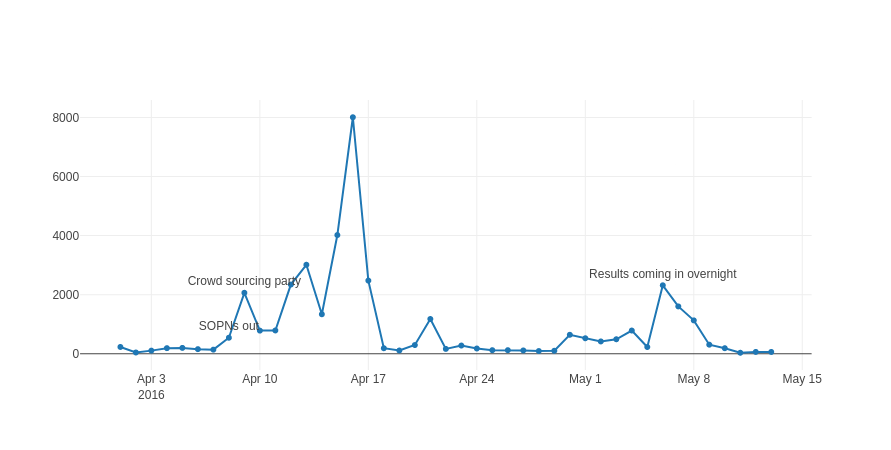
In 2015, volunteers accurately crowdsourced 4,000 candidates in advance of the publication of the Statement of Persons Nominated (SOPN). This is the document published by electoral teams in councils once the deadline has past and all the candidates have paid the deposit, completed the requisite paperwork, and achieved the necessary nomination.
This year, we did not achieve the same level of coverage before the official SOPNs were published. This was partly due to building the crowdsourcing website later than planned, and there being vastly less media coverage of candidates to use.
However, for the devolved assemblies, we did come across campaigners and enthusiasts keeping their own spreadsheets, which suggests that if we had begun crowdsourcing earlier we could have achieved more, earlier.
Once we knew the SOPNs were published, a small number of volunteers came together to find the published PDFs, which were scattered across hundreds of council websites.
Once found, these PDFs could be displayed alongside the election pages of our candidates crowdsourcing website, making it easy for volunteers to transcribe the data from the PDFs into our online forms. Most of the data was crowdsourced from the official statements and then checked by another sourcer before being ‘locked’, ensuring a very high level of accuracy.
We achieved full coverage of the scheduled elections weeks before the 5th of May, and went on to use the remaining time to find by-elections and the associated SOPNs. This resulted in a grand total of 13,068 candidates in the database by polling day.
This is an extraordinary achievement, made possible only by the efforts of many volunteers. If, eventually, councils can get to a place where this data is all published in an open format at a predictable location, the hours these volunteers spent could be employed to more productive ends.
Creating a polling station finder
As with candidates, we had set out with ambitious targets for polling stations, but after many conversations with even supportive councils it became clear that acquiring, checking and cleaning the data was a significantly time-consuming process. Data could be provided in many different formats and at many different levels of quality.
There were also a number of councils who were not supportive and did not immediately see the value in this tool, raising issues around data becoming out of date. Some councils maintained their own slightly uninspiring polling stations finders, e.g. some simply told people where their nearest station was, which is misleading given how polling districts work.
Our target became to gain good coverage in Wales, and together with the support of NUS Wales and the Welsh Government, we regularly communicated with the 22 councils, providing information on how to provide the data in ideal or good-enough formats. Many were keen to help and several were quick to provide the data. Others found it hard, or provided only partial data. Some councils did not respond at all.
Outside of Wales, there were a small number of councils who already provided the data, and some who got in touch with us in the weeks before the election to include their data. West Berkshire were able to embed the finder we designed directly into the council website.
Where we had doubts about the data supplied, we erred strongly on the side of caution and did not use it. Instead we directed users to the phone number for the council electoral team, supplied by a GOV.UK register.
Recording the results
For the local elections in England, we joined with the Local Government Information Unit (LGiU) and the Open Data Institute to trial the production of open election results data. This was an experimental project — something we have not done before due to our focus on user need before the election — but it has been regularly requested and will, over time, add value to voter information tools, e.g. for those who wish to vote tactically.
From 11pm on the night, LGiU rota-ed staff over the subsequent three days while results were announced. We focused initially on council control, as a change in council control makes the biggest difference to a council’s work. We are continuing to collect results data at an individual ward level: votes per candidate, winner, spoil ballot and turnout recorded. We allow anyone to add ‘unverified’ data and then a team of trusted volunteers and staff at LGiU confirm these submissions in order to ‘verify’. Full results data should be available by June 2016.
4. The four year plan

A. We want to cover every election
While we’ve solved election identifiers — and we encourage everyone to adopt this — we still need a way to know an election is happening, including by-elections. There exist people with good local expertise who know this for their patch, but we need a way to scale this process nationally.
While we aspire to convincing the government to produce a national register of elections that councils must add upcoming elections to, we realise this is a way off. Immediately, our first step may be another crowdsourcing app, but one that asks people to find and add upcoming elections. The app can be structured in such a way that it can automatically generate correct identifiers by walking people through several questions.
To work, this will require awareness and willingness from council election teams and election enthusiasts. There are of course huge advantages in having one canonical source that produces open data for anyone to use. This way we can create a coherent, lasting set of correctly identified elections that media companies, local government and campaigners can build reliant systems upon. Furthermore, Democracy Club would be able to run a very simple election alert service for interested citizens.
B. We want to have details of every candidate, as early as possible.
Once we know about elections, we need to start crowdsourcing the details of candidates running as early as possible. Political party members have told us that candidates for GE2015 were sometimes chosen years before May 2015. We do not know how far in advance candidates for local or regional seats are chosen, but we can assume that if we plan to serve campaigners, journalists and academics who are already thinking about May 2017, we need to have the crowdsourcing platform up and running as soon as possible. Several commenters also wanted at dataset that included photos of every candidate.
C. We want more people to use the data.
We also need to let people know that the data will exist - and encourage activists and campaigners to join together to update a single open database, rather than maintain their own at significant cost to themselves. This will be helped by getting data early.
D. We want to help people find out where the candidates stand.
The most consistent comment left as feedback by visitors to WhoCanIVoteFor — and we extrapolate to all voters — suggests that they seek more than simply a list of names of candidates and their social media links. As we heard again and again: they want to know where their candidates stand, their manifestos and their policies.
In future we can certainly link to party manifestos, but voters may be seeking information on individual plans and policies, particularly at the local level. In the days before the election we tested a short candidate survey on those candidates whose email address we had.
We tested what we thought were the minimal viable questions for establishing where a candidate stands, asking them:
- A personal statement, something between a biography and a pitch
- Their top three priorities for their prospective time in office
- (Somewhat cheekily) to name a rival candidate and explain why a voter should not vote for them
- One specific decision that they would campaign for and against
As expected, some candidates replied pointing out that they’d be happy to do this if they had had more notice. But we did receive around 50 responses that suggest that this approach may work well in future.
We did not set strict word limits, but the vast majority provided short comments that would work well for a voter quickly reviewing candidates. All responses were able to give three priorities, and roughly half were able to point to specific decisions that they would campaign for or against (the others just stated broader priorities again).
A majority of respondents chose not to point out another individual that voters should not vote for (several stated that they would not engage in ‘negative campaigning’), and instead, most used the question as an opportunity to explain why they were uniquely qualified for the role.
Given the examples above, we believe there are strong prospects to far better meet user needs at WhoCanIVoteFor in future. In order to test this assumption, in advance of what we hope could be significant use in May 2017, we hope to try to receive a full set of candidate survey responses for a by-election.
The Tooting by-election on the 16th of June is too soon for us to work with, so we will use a local by-election. A council, local news or hyperlocal blogger partnership and supportive local candidates would help us to achieve a pilot here.
Another way to test this approach is with lab experiments. We could run an imaginary election, and test mock statements, pledges, perhaps even video pitches on participants, and see if they decide differently, how they used the information, and what else would help them decide.
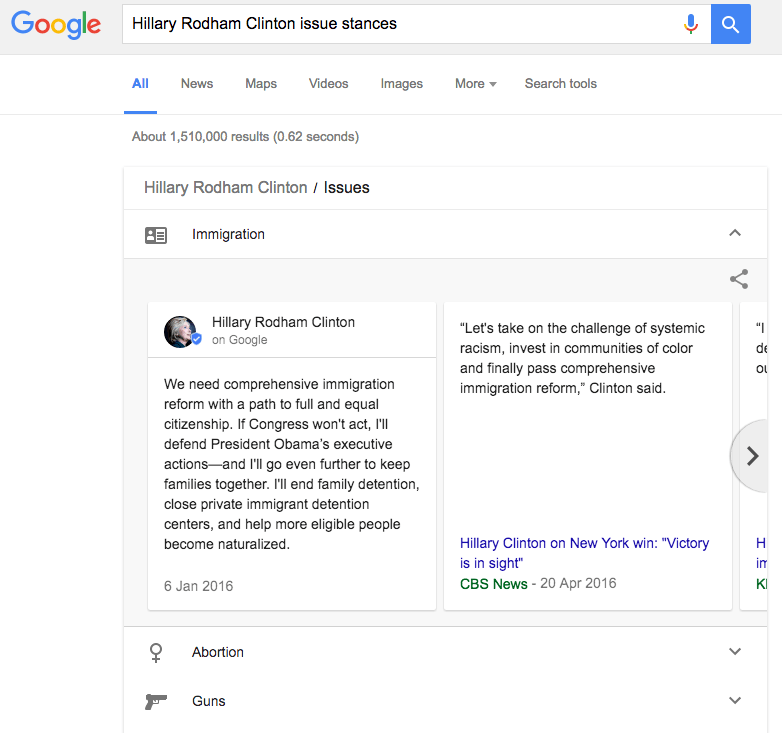
Lastly, it’s worth pointing out that Google have been testing one approach for the US Presidential election, providing highlighted search results based on statements from candidates. We plan to meet with the elections team at Google after the US election on the 8th of November.
E. We want to vastly improve coverage of the polling station finder
We have learned a considerable amount about how councils manage data on polling locations and districts and how to convert data in many formats into useful information for voters. The London Elects polling station finder suggests that with government heft it is possible to deliver a universal service.
The EU Referendum presents an opportunity to improve coverage in the immediate future. Ten Welsh councils are now in a place to easily provide changes to locations (if any) - and we hope to be able to get the London Elects data for all 32 London boroughs.
There does appear to be near universal agreement that the provision of an online polling station finder is a good thing, in local government at least. We are now seeking funding to make this real. We think there may be a financial interest from councils who will save money on phone calls from voters trying to find their station.
The hard graft to expand the tool is the liaison, persuasion and convincing of councils, then getting the data in the best format, dealing with issues and bugs and interesting cases that inevitably appear in the data. The gap between electoral services teams and the council GIS teams (if they existed) was sometimes quite great. In future we should look to GIS/IT teams first, and only contact electoral teams for permission (rather than asking the electoral teams to help get the data). However, electoral teams are more open to the public — we found it was easy to reach electoral teams via email or phone, but much harder to connect to IT or web teams, perhaps as they only serve internal clients. We will seek to partner with organisations who have better connections into councils in order to open more data.
F. We want to be able to tell people who won.
It should be easy to find out what happened in the election you just voted in. This isn’t the case, certainly for local elections. More quickly closing feedback loops — i.e. telling people what happened in their election as soon as possible — will enhance trust and the likelihood of participation. Some councils already offer this service, but this should be nationwide. Much of the feedback left on WhoCanIVoteFor.co.uk in the days after the election was from people expecting to find the results there.
Our experimental results data crowdsourcer was built in a hurry and could be improved to make it easier for the crowd to build a comprehensive data set. For example, users should have the ability to correct others’ mistakes; and we should include electorate total, which will be useful for understanding turnout.
Aside from the local elections in England, every other election in the UK involved non-FPTP voting systems. In future, will need to be able to support these systems to show how votes worked. We’ve seen a good example from Open Data Institute Northern Ireland for Single Transferable Vote results.
We may have been too officious in setting a two-step verify process for data. It maybe that if we open it to the crowd to input and the crowd to approve or flag problems we would have completed the dataset more quickly. Particularly as many council staff seem willing to enter data for their elections, we should perhaps lean towards trusting users more. We will review this approach in future.
G. We want to continue to learn from elections up to 2020.
We want to do all of the above until (to the extent appropriate) government delivers it. It is hard to imagine government providing this data and these services before 2020. As a result, we plan to take advantage of local government elections in 2017 and 2018, and the possible European Parliamentary elections in 2019 to test and iterate services up to the next scheduled general election in 2020. By doing this year in year out, we aim to build trust, credibility and raise awareness that this data will exist and can be relied upon to build voter information tools.
We hope that by 2020, digital media companies, charities and governmental institutions will be, as a norm, creating better and better tools for their audiences, members or citizens. This way we can reach millions of people to create a better informed electorate.
5. After May 2020
 Credit: Bill Higham
Over time, we expect to see to see governmental bodies produce nationwide level election, candidate and polling station location data. This kind of data, perhaps combined with GOV.UK’s new Notify platform, will allow push notifications to occur when an election is announced or on polling day itself.
In terms of candidates, government is only likely ever to announce these at the time the official ‘short campaign’ begins, so there is likely to remain a demand for ‘unofficial’ candidate data before this, which can be verified against the official information once announced. Because much of this data will be managed or owned at the local level, we have previously written on how this can be simply turned into a national database through the use of predictable URLs updated at a local level.
We would also like to see the service design for standing as a candidate to become simpler, digital - perhaps nominations could occur in real-time; more information could be captured on candidates when they register (most basically, a request for their campaign email address would be useful).
This will give civic technology groups such as Democracy Club the chance to focus on the elements that government should not be doing, such as:
- Answering the ‘Who should I vote for’ question so popular on Google Search last year
- Questions-to-candidates apps and assisting candidates with correspondence management
- Support for hustings events that blend the best of offline and online
- Tactical voting tools: if you want to achieve this outcome, vote this way
We have many more ideas for making democracy easier, more user-friendly and perhaps even more fun through digital services. These exciting projects can only begin to be realised once the basic data infrastructure is there, which remains our goal for the next few years.
6. Making it happen
What we need
Democracy Club was originally begun as an informal group of volunteer developers working together on the 2010 General Election. It was restarted in 2014 by Sym Roe in preparation for the 2015 General Election, and a Community Interest Company was formed in February 2015.
In January 2016, with small grants from Google.org, the Rowntree Trust and Bethnal Green Ventures, Sym Roe and Joe Mitchell began to work full-time on the project. We subsequently received a grant from Welsh Government through NUS Wales for additional support to Wales. More recently, we also won an ODI Showcase grant (with LGiU) to assist with the results work.
It is not sustainable to run an organisation that provides essential national data infrastructure on small project-based grants. We need to build a team with a depth of knowledge, experience and drive to design non-partisan tools driven by user need.
We believe we require a small agile team of two to three developers, a general project manager, and designer and user researcher to achieve our goals for the period to the next general election. The additional support of copywriters, user experience experts and partnership managers will be required on an ad-hoc basis.
We have estimated the cost of this team at around £250,000 per year until at least June 2020. There will be scope for undertaking additional project-based funding.
Where should the money come from?
We believe that everyone benefits from better political decision‑making.
More specifically, voters going to the polls benefit from better information when they use an online tool (such as WhoCanIVoteFor, or use the data via a partner like Buzzfeed).
Secondary beneficiaries are the partners themselves, who get to access the data for free to provide useful content to their audience (and thus gaining advertising income) or, if a campaign body, to campaign more effectively on their issue. Councils and government also benefit, most immediately from fewer phone calls from the public trying to find information, but also from increased trust in the system and a more participatory public.
Each of these groups of beneficiaries could be targeted for funding: voters via a crowdfunder; partners via a small coalition funding programme; or government via a subscription service for councils or grants from central government institutions. We will also continue to seek philanthropic funding.
We regard the cleanest, simplest funding mechanism for the open data projects — particularly given its scale — to be central government funding. The open data element clearly resembles a public good, i.e. it is ‘non-exhaustive’ and ‘non-exclusive’ (the data and the digital services do not run out out the more people use it, nor can we exclude any group from using the data or the apps).
As economists talk about lighthouses, roads or clean air, we should talk about open democratic data and its public provision. We plan to continue to press this argument to government; advice on how to do this is welcome.
We are grateful for every donation, grant and connection to funders.
7. Acknowledgements
Thanks are due to many individuals and organisations who have helped us make significant progress over the last 18 months.
First, to the volunteers across the UK whose willingness to spend hours writing code, providing feedback and inputting data is testament to the power of the crowd.
Tim Green, Mark Longair, Andy Lulham and David Miller have been highly involved throughout the last 18 months and the candidates work could not have happened without them.
Chris Shaw appeared at the perfect time to help making the polling stations project happen.
Every data point matters, but some individual ‘data wombles’ in particular deserve a call out: ‘JeniT’, ‘j4’, ‘duncanparkes’, ‘sjorford’, ‘markcridge’, ‘charlottemaddix’, ‘northernjamie’ and ‘fbrc’ are democracy heroes. And there are many, many more.
To those who are not involved in Democracy Club, but maintain their own lists of by-elections, candidates and results, we salute you, and thank you for your generosity in sharing your data.
Second, to the funders and backers who have made it possible for a core team to work on the project full time, leveraging the work of the hundreds of volunteers into an institution that is building its reputation, shifting expectations of what is possible, and providing a service that tens of thousands of people find valuable.
That’s Google.org, the Joseph Rowntree Charitable Trust, Bethnal Green Ventures and the Welsh Government. The project would not have been possible without the in-kind support of mySociety on the candidate crowdsourcer.
Third, we have had significant institutional support from friends at the Electoral Commission, who in our first meeting recognised the value of what we were attempting to do, and continue to help us out by making requests to councils on our behalf and by linking to the site for many of the 2016 elections.
Thanks too to NUS Wales for establishing the partnership with the Welsh Government and working hard to convince councils to open their data, and to promote the site to students.
The consistent enthusiasm of our friends in LocalGovDigital has helped push the project forward, and thanks are due to several staff at councils across the country who have enthusiastically pushed their institutions to help pursue these goals.
Lastly, thanks to every user that left feedback, tweeted or emailed us, every candidate that updated their profile, and our band of twitter followers who have pushed and retweeted all our news, blog posts and services to a wider audience.
Together, we will make democracy work better for everyone.
8. Annexes
Annex 1: Theory of change and evaluation
We believe that the work we do will ultimately increase societal wellbeing. Earlier this year we sketched out that happens.
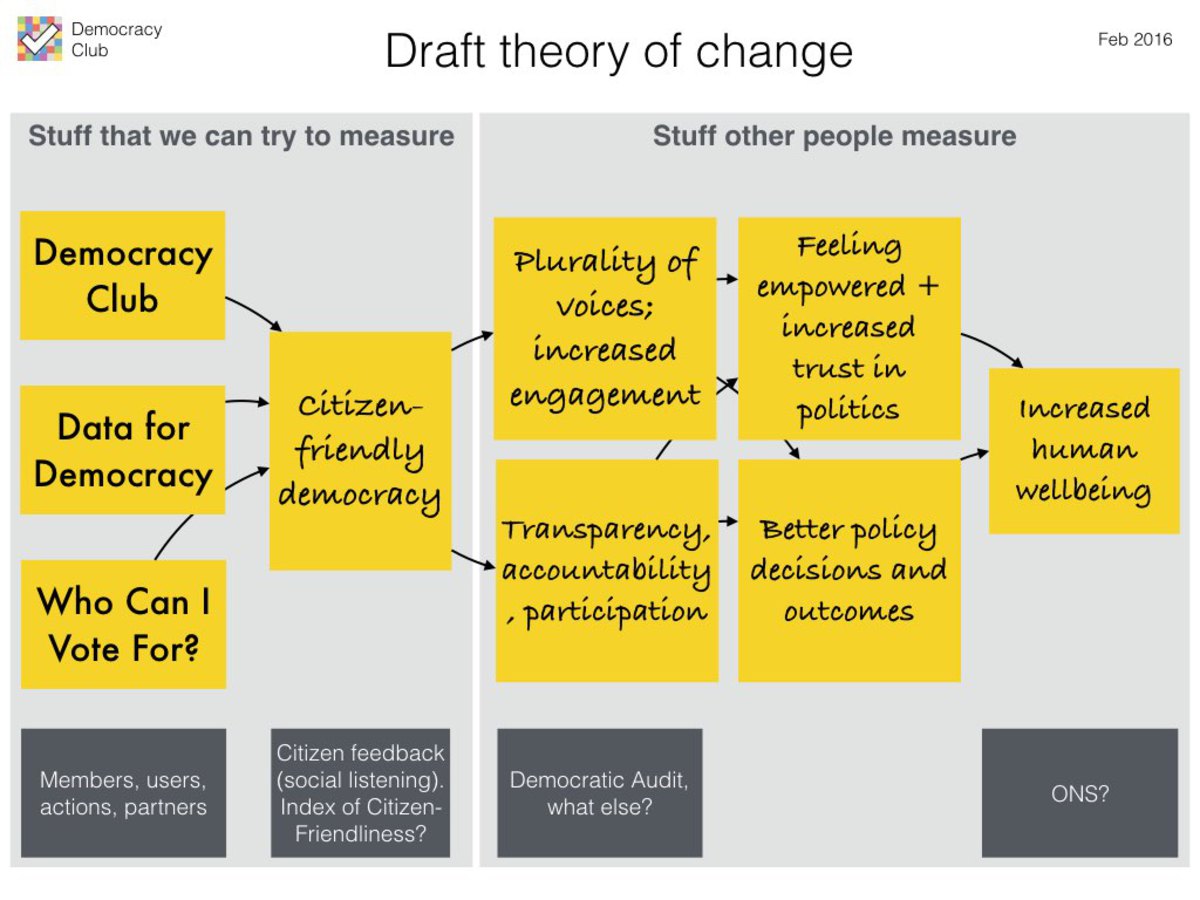
There is much existing evidence that enhanced trust in politics and feelings of empowerment lead to greater human wellbeing (for a summary of the literature, see the Legatum Institute’s Commission on Wellbeing and Policy, 2014).
We are looking for support in measuring the effects of the work we do to test for an increase in trust and empowerment. We also make an assumption that a better informed, more participative electorate will make better decisions that in turn also contribute to greater wellbeing.
Annex 2: Election identifiers
We have produced unique identifiers for any state-run election in the UK.
You can read more about these IDs on the Election ID project page
Annex 3: Councils providing polling station data for May 2016
| Council | Polling Stations | Polling Districts | Addresses |
|---|---|---|---|
| Camden Borough Council | 60 | 60 | 0 |
| Cardiff Council | 203 | 205 | 0 |
| Ceredigion Council | 94 | 0 | 35,197 |
| City of Edinburgh Council | 155 | 156 | 0 |
| City of London Corporation | 4 | 4 | 0 |
| Conwy Council | 92 | 91 | 0 |
| Denbighshire Council | 67 | 0 | 34,442 |
| Ealing Borough Council | 141 | 136 | 0 |
| Gwynedd Council | 154 | 154 | 0 |
| Haringey Borough Council | 82 | 0 | 64,145 |
| Merthyr Tydfil Council | 65 | 0 | 27,373 |
| Neath Port Talbot Council | 136 | 0 | 65,655 |
| Pembrokeshire Council | 129 | 0 | 62,920 |
| Rhondda Cynon Taf Council | 179 | 0 | 108,478 |
| South Cambridgeshire District Council | 111 | 110 | 0 |
| Vale of Glamorgan Council | 125 | 125 | 0 |
| West Berkshire Council | 115 | 115 | 0 |
Up to date data can be found at the polling stations league table.