2025 election report and user feedback
We’ve published our report on our activities during the May 2025 local elections. Read the full report now, or scroll down for an overview of our user feedback.
The May local elections passed off successfully for Democracy Club. We processed 1.5 million postcode searches during the election week - pretty good considering most of the country didn’t have an election!
Some highlights:
- 1.5 million postcode searches in election week.
- 74% user satisfaction on Who Can I Vote For and 88% on Where Do I Vote.
- External partnerships provided over 60% of our user traffic during election week.
- We modified our websites to give information to voters in areas with postponed elections.
- Relaunched ElectionLeaflets.org.
User Feedback
Each election we ask visitors to our sites about their user experience. They’re invited to answer two questions: whether they found what they were looking for, and their likelihood to vote. They are also offered an opportunity to provide written feedback.
From midnight on Monday 28 April until close of polls on Thursday 1 May, 2,428 responses were collected:. 1,864 users submitted feedback on Who Can I Vote For, and 564 on Where Do I Vote.
‘Did you find what you were looking for?’
| Source | Responses | % Yes |
|---|---|---|
| Who Can I Vote For | 1,864 | 74% |
| Where Do I Vote | 513 | 88% |
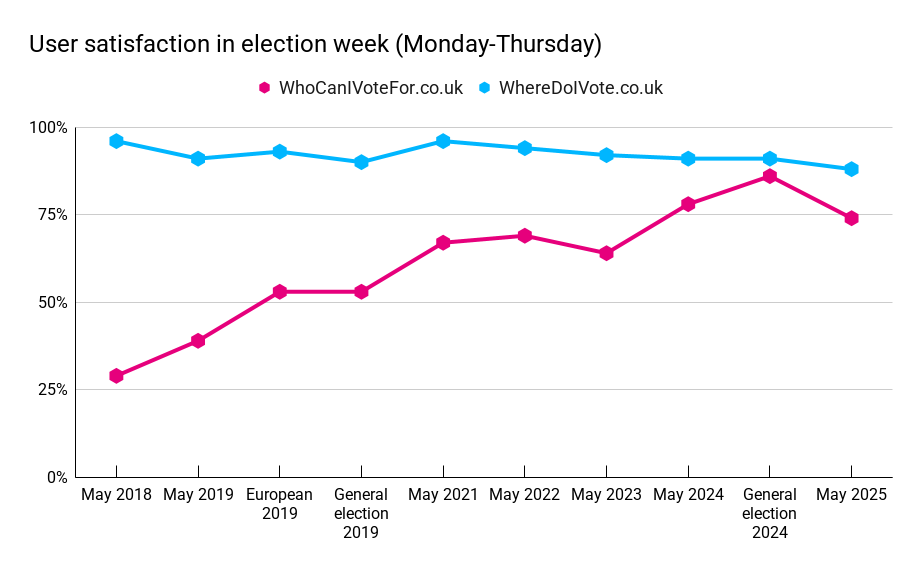
Who Can I Vote For saw a 12% decrease in user satisfaction when compared to the general election, and a 4% decrease from the May 2024 local elections. This is not surprising; the general election saw record satisfaction with a high level of candidate information, while areas with postponed elections dragged down the results as compared with the 2024 locals.
Where Do I Vote saw a similar decrease, from 91% in May 2024 to 88% in the most recent local elections. This continues a trend of decreasing satisfaction with the polling station finder, down 8% from a peak of 96% in 2021.
As is usual, written feedback suggests a general dissatisfaction with the elections as a whole, rather than our services, although we note that the lack of maps for many polling stations continues to bring negative feedback.
‘Has this information made you more likely to vote?’
A total of 2,008 users responded to this question’. Users on Who Could I Vote For were able to choose from three options: ‘more likely’, ‘less likely’ and ‘I always vote (no change)’. The majority, 1,069 responses (66%) selected ‘I always vote (no change)’, while 11% of users selected ‘less likely’. On Where Do I Vote, 78% of those who responded selected ‘yes’, this remains the same as the 2025 General Election, and a 2% decrease from the 80% from the 2024 local elections.
‘Has this information made you more likely to vote?’
| Source | Responses | % Yes |
|---|---|---|
| Who Can I Vote For | 1,608 | 22% |
| Where Do I Vote | 400 | 78% |
Written feedback
In response to ‘can you tell us anything more?’ a total of 686 written responses were submitted (621 on Who Can I Vote For and 65 on Where Do I Vote).
Much of the feedback was along the usual lines, with users requesting more candidate information, data on Parish and Town councils, and many using the opportunity to vent their views on the election and policy issues in general.
A considerable number of users expressed concerns about the limited information candidates had available on their pages. A total of 235 responses (representing 38% of written submissions on Who Can I Vote For) raised concerns about the lack of accessible candidate information. These submissions highlighted difficulties in finding online public information, both on Who Can I Vote For and other websites, as well as the lack of direct communication in the form of leaflets or canvassing.
-
“We have received NO information from, or about, any of the candidates prior to the election!”
-
“Personally i dont think anyone should be able to stand if they don’t provide some sort of at least a summary manifesto”
-
“The Durham County Council website was not helpful and I gave up after wading through multi-page pdfs”
-
“It would have been nice to see photos for all candidates. It opens up their accessibility to voters which I would be be expecting.”
Postponed elections
The postponement of elections in nine areas caused some confusion among the public, with many unsure whether their area had been affected. Over 100 responses matched this theme, with many using feedback forms on archived elections (we did not show feedback forms for areas with no election, but did offer them to users with postponed elections)
-
”I just think the postponement is disgraceful and only proves that the government know they are useless”
-
”It would seem that I don’t have a vote, is this due to Labour cancelling the election in my town . And how can I find out.”
-
“This election has been badly relayed to the public and many people aren’t sure if they are supposed to vote today or not.”
Sentiment analysis on written feedback responses
As we did last year, we have utilised Amazon’s Sentiment Analysis tool to better understand the tone of written feedback and how it relates to users’ voting intentions and their satisfaction with our sites. The tool categorises sentiment as ‘positive’, ‘neutral’, ‘mixed’, or ‘negative’. The most common tone among the written feedback is ‘negative’, highlighting users are typically drawn to the written feedback opportunity to voice dissatisfaction.
| Source | Positive | Neutral | Mixed | Negative |
|---|---|---|---|---|
| Who Can I Vote For | 64 | 243 | 9 | 306 |
| Where Do I Vote | 17 | 31 | 1 | 16 |
The feedback submitted indicates a generally positive response from users regarding the utility of our sites, particularly regarding the convenience and accessibility of having polling station and candidate information in one place on Who Can I Vote For. Users noted how it reduces decision fatigue and facilitates a more informed voting process. However, as highlighted in the sentiment analysis, the written feedback opportunity draws a higher percentage of users who wish to voice dissatisfaction with various topics concerning the election, whether that be in relation to Who Can I Vote For and Where Do I Vote, or broader issues regarding the elections.
Praise
Of course, it’s not all negativity!
-
“This service allows me to find the information on different options in one place and reduces decision fatigue making it easier for me to choose who to vote for. Having the location there too greatly helps.”
-
“Helpful to see the links and photos provided by candidates…I wasn’t even sure how many votes I had until seeing this!”
-
“It’s good to know what each person aims to do. To have an insight gives me options.”
🎭