Charts & graphs: the 2022 local elections
Three nations, 200 councils, 6,872 seats, and 21,070 candidates - there’s an awful lot going on in the 5 May local elections. Here at Democracy Club we’ve worked with our amazing volunteers to crowdsource a comprehensive database of every candidate standing. Not only does our data contain name, party and ward for each candidate, but in many cases we have candidacy details stretching back to the 2016 local elections.
Drawing on this information, this blog presents some unique perspectives on the candidates and parties standing for election in 2022. Enjoy!
The election🗳
This year’s local elections offer an interesting mix of different areas, with plenty to look out for.
Of the 200 councils holding scheduled elections, half are electing the whole council, with the main focus on Scotland, Wales and London, who together represent 62% of all seats up. Other prominent ‘all-up’ councils in the rest of England include the City of Birmingham and four new unitary authorities in Cumbria, Somerset and North Yorkshire.
Of the remaining 100 councils, six are electing half of their council, and the remaining 94 a third. There are also seven mayoral elections, including that of South Yorkshire (not covered in this blog).
In total, 6,872 principal council seats are up for election - that’s 6,819 ‘scheduled’, plus 53 additional English by-elections.
The parties 🥳
There are 399 registered political parties in Great Britain. Here at Democracy Club we pride ourselves on our accuracy. By maintaining a copy of the Electoral Commission’s party database, we’re able to correctly match candidates to parties even in the case of minor or hyperlocal groups. Consequently, we can say that precisely 136 registered political parties are standing candidates in this year’s local elections.
That said, 79% of candidates represent one of the big four parties (Conservatives, Labour, Liberal Democrats or Green Party of England & Wales), and a further 5% represent the SNP & Plaid Cymru. Across the whole of GB, Labour are standing 5,380 candidates (78% of seats), while the Conservatives are just shy of them at 5,333 (78%). The Liberal Democrats are fielding 3,657 (53%) and the Green Party of England & Wales 2,336 (34%).
One fact which immediately catches the eye among the minor parties is the collapse of UKIP, which has fielded only 28 candidates across the three nations. In 2017 (when Scotland and Wales last held elections), the party stood 44 candidates in Scotland and 80 in Wales - this year they are fielding 11 and zero respectively. The trend is even more marked in England. As recently as 2019 it fielded over 1,000, in what was a particularly large set of elections.
Furthermore, UKIP candidates have not been absorbed by a party of similar size, but have either left politics altogether or splintered across multiple parties. This is where our historic data comes into play! Our volunteers have identified at least 130 former UKIP candidates (2016-2021) who are standing for something else this year - mostly as Conservatives, Independents or Reform UK.
Who’s got the most - and least - choice? 🤔
If you are in need of some excitement this election period, where better to look than at the busiest ballots? England, Scotland and Wales all have some particularly busy ballots this year.
With 20 candidates standing for 4 seats, Cathays in Cardiff has the longest ballot this election. On the other hand, Leith Walk Edinburgh, with 12 candidates standing each from different parties, has the most parties running in a single ward!
If you’re still looking for hot competition though, look no further. Of all the local elections taking place on 5th May, here are the wards with the most candidates standing per seat.
With eight candidates running and just 1 seat up for election, Kingstone in Barnsley has the most candidates running per seat, making this the most in-demand seat in the UK. Kingston is followed closely by Hatch Warren & Beggarwood, Keighley West, Shipley, St Luke’s, and Bedwardine, all of which have just one seat up for election with seven candidates in the running. Two of these wards, Keighley West, and Shipley are in Bradford - something in the air, maybe?
In fact, there might be: the East Midlands has the most candidates running per seat (4.2), followed closely by Yorkshire and the Humber (4.1).
Looking at local authority areas as a whole, here are the council areas with the most and fewest candidates per seat, making Southend-on-Sea the busiest council this election:
Interestingly, the top 10 local authorities with the most candidates running per seat are all in England, where the majority of local authorities with the fewest candidates running per seat are in Scotland. However, this is likely to be largely a result of the use of the STV in Scotland. Overall, Scotland has only 2.1 candidates per seat, compared with 2.7 in Wales and 3.5 in England.
Unfortunately, short ballots are much more common - 499 ballot papers in England and Wales have only two party options on them.
Who’s already won? 🥇
Of the bottom ten councils, two in particular stand out as areas where the lack of party competition has a marked influence on the makeup of the council. In Gwynedd, a whopping 28 seats (40%) have already been won uncontested. Meanwhile in Barking & Dagenham, the lack of opposition candidates means that Labour are already guaranteed 15 seats in ‘under contested’ wards - that is, places where there are fewer than 2 candidates per seat in a multi-member ward. In Beacontree, for example, there are 2 seats but only three candidates - two Labour and one Tory. Labour are therefore guaranteed a seat whatever happens.
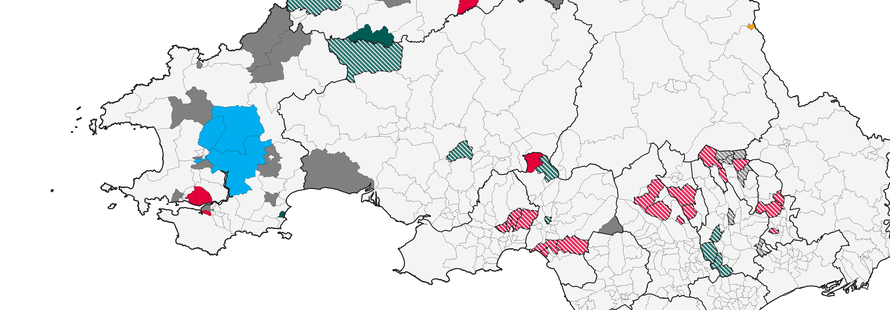
Over Britain as a whole there are 97 uncontested seats - 74 of these are in Wales, 18 in Scotland, and 5 in England. We’ve also identified 68 ‘under contested’ seats in 57 wards across England and Wales; 25 in the former and 43 in the latter. This means that 165 seats (2.4%) are already guaranteed to a party before any ballot has been cast (see our briefings for more detail).
As a final treat, here are the uncontested and under contested seats mapped across Wales:

Names & gender 👩
Last year we worked with the Fawcett Society to publish estimates of candidate gender. The same analysis this year shows little change - 34% of candidates across Great Britain are women, with no significant difference between the three nations. There are substantial variations between the larger parties, however:
| Party (GB-wide) | % Female Candidates |
|---|---|
| Scottish Green Party | 47% |
| Green Party (E&W) | 43% |
| Scottish National Party | 42% |
| Labour Party | 41% |
| Plaid Cymru | 34% |
| Liberal Democrats | 32% |
| Alba Party | 31% |
| Conservative Party | 29% |
| Trade Unionist and Socialist Coalition | 28% |
| Independents | 24% |
| Reform UK | 23% |
This gender ratio is reflected in the most common candidate names. Last year the most common first name was David, closely followed by John. This year it’s…David, closely followed by John! Here are the top-five:
David (497)
John (486)
Paul (334)
Peter (276)
Andrew (242)
The most common woman candidate’s name is Sarah (126), which comes in at number 17.
The most common last name across Britain? With all councils in Wales up for election, you might not be surprised to learn that it’s Jones, followed at a distance by Smith.
Party switchers 🔄
And finally, another Democracy Club exclusive! As already mentioned, our database links current candidates with their past election history. This data goes back to 2016 and is now quite a substantial archive.
With it we’re able to do things like compare party affiliation over time. You’ve already seen one example, that of the former UKIP candidates, above. But why not try it with all parties?
Using our database, we’ve identified current Scottish, Welsh and London candidates who have switched parties since the last election - 313 in total (2.6% of all candidates in those three areas). We’ve picked these areas because they do not elect by thirds or halves, unlike much of England, which makes the analysis more straightforward.
The three Sankey diagrams below show the result - the 2017/2018 party on the left, and the 2022 candidacy on the right. Please note these are not comprehensive figures, only the candidates our volunteers have been able to identify.
View the full size Scotland chart.
View the full size Wales chart.
View the full size London chart.
About the data 📈
The data in this blog is drawn from over 3,500 nomination documents published by English, Scottish and Welsh councils between 30 March & 6 April 2022, collected using a combination of automatic scraping and our amazing network of hundreds of volunteers. The final dataset was completed and double-checked by 10 April 2022.
We are incredibly grateful to the volunteers who help make this available. They are the heroes that empower millions of us every election.
Words & visualisations: Peter Keeling & Eleesha Taylor-Barrett. Data analysis by Michael Collins & Sym Roe. Map by Will Roper. Reading by you.