2026 elections user feedback
During the election period, our digital tools WhoCanIVoteFor.co.uk and WhereDoIVote.co.uk processed 10.5 Million postcode searches. This marks our highest level of user activity since the 2024 General Election and our second-highest level of user activity ever!
With increased traffic, we received lots of great feedback. Here’s what our users told us.
Across our platforms, we asked users two questions:
- Did you find what you were looking for?
- Has this service changed your likelihood of voting?
Users could also leave additional comments to elaborate on their feedback.
We received 14,241 feedback responses across our platforms.
Did you find what you were looking for?
During election week (Monday 4 May to Thursday 7 May), we received 5,211 responses on WCIVF and 3,341 responses on WDIV to this question:
| Yes | No | |
|---|---|---|
| WCIVF | 76.63% | 20.19% |
| WDIV | 88.42% | 11.58% |
Here’s how these figures compare to previous elections:
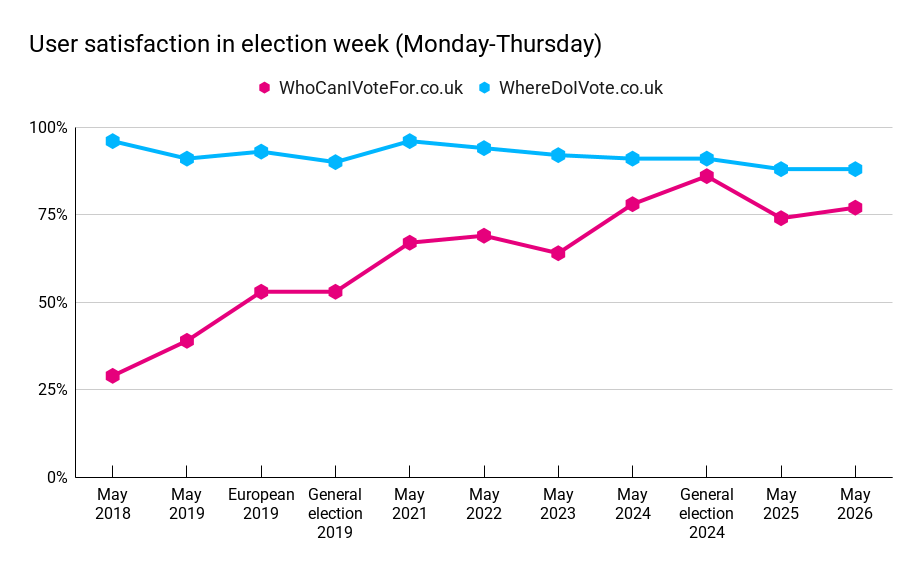
Satisfaction with WDIV remains consistently high. Given our increased use of polling station maps which introduces additional opportunities for errors, maintaining such high levels of user satisfaction is a positive result.
WCIVF also saw a modest increase in user satisfaction compared with the previous election cycle. This is particularly encouraging as WCIVF typically attracts more critical feedback, a trend discussed later in the blog.
Has this service changed your likelihood of voting?
During election week (Monday 4 May to Thursday 7 May), we received 4,411 responses on WCIVF and 2,887 responses on WDIV to this question:
| More Likely | Less Likely | No Difference | |
|---|---|---|---|
| WCIVF | 30.29% | 8.16% | 61.55% |
| WDIV | 44.20% | 3.26% | 52.55% |
Excitingly, around a third of WCIVF users and almost half of WDIV users said our services made them more likely to vote. This is a significant increase from 2025, where 22% of WCIVF users reported being more likely to vote.
While the majority of users expressed that our services made no difference to their likelihood of voting, accompanying feedback suggests these users had always intended to vote and our services provided reliable information to prepare for the election.
“Very useful thank you I was always going to vote”
“I always vote. I was looking to refresh my memory on who the candidates were.”
For the small number of users who reported being less likely to vote, the feedback focussed on a lack of candidate information and disappointment regarding the absence of preferred parties on local ballots.
Here’s how this year’s feedback compares to previous election cycles:
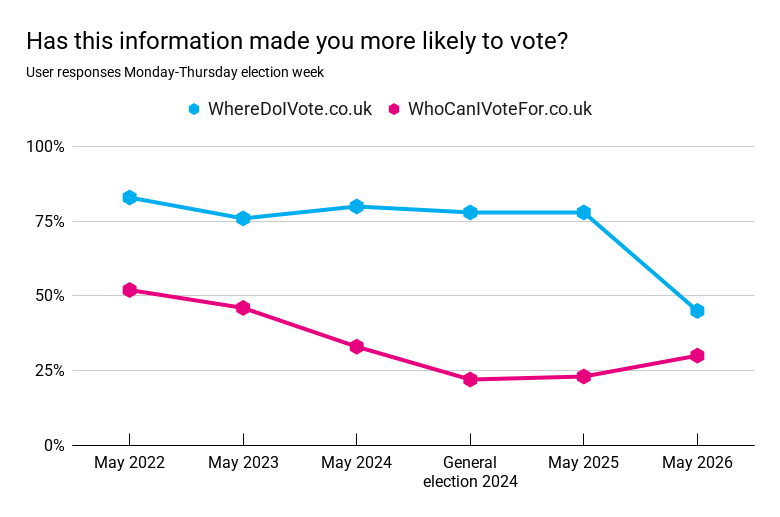
While the graph indicates a decline in WDIV users reporting that the platform increased their likelihood of voting, this is due to a change in our feedback survey responses. This year, we replaced Yes/No responses to the “Has this service changed your likelihood of voting?” question with more nuanced responses (more likely, less likely, and no difference). These three responses were introduced on WCIVF in 2024. These responses allow for greater accuracy at the cost of comparison with previous years.
Feedback Comments
WCIVF presents information on candidates and their policies which naturally generates more reactive feedback responses. Many critical comments expressed frustrations about local candidates, political parties, and wider concerns about politics rather than with our tools.
The most common request was overwhelmingly for more candidate information:
“There’s no information about the candidates’ policies! How are we supposed to decide who to vote for?”
“Details of ALL the candidates would be preferable if I am to vote for them!”
“There is almost no information about the individual candidates whereas I would have expected some form of mini CV.”
Many users were unaware that candidate profiles are completed by candidate submissions or through the work of Democracy Club volunteers. Making this process clearer could help users understand why some candidate profiles contain more information than others, while encouraging candidates to submit more details about themselves. This would also help to address feedback such as:
“If [candidates] can’t be bothered to advertise themselves then I can’t be bothered to vote”
“How can anyone make an informed decision when most of the candidates cannot be bothered to submit a photo or CV?”
“Why only picture of one candidate, that’s unfair bias, please have none or all of them”
Feedback on WDIV was generally more positive. Many users reported that the service helped them find their polling station after misplacing their polling cards or reassured them that they were heading to the correct location.
“I knew my polling station had changed and it was easy for me to look it up”
“This was very helpful as although I am registered to vote, I did not get sent a poll card telling me where to go.”
“I couldn’t find my voting card so didn’t know which polling station to go to. Thank you”
Feedback by Nation
We also looked at feedback responses by nation during election week to understand whether users’ experiences differed across England, Scotland and Wales.
| Nation | Did you find what you were looking for? | Has this information made you more likely to vote? | ||
|---|---|---|---|---|
| WCIVF | WDIV | WCIVF | WDIV | |
| England | 75.74% | 79.22% | 25.51% | 30.66% |
| Scotland | 83.79% | 78.71% | 27.50% | 30.10% |
| Wales | 80.21% | 82.00% | 24.06% | 26.99% |
Satisfaction was high during election week across England, Scotland, and Wales, demonstrating that our services are effective across multiple electoral systems.
Scottish users were most likely to report finding what they were looking for (83.8%) and were more likely to vote as a result (27.5%). Scottish users also provided useful feedback, expressing a desire for more clarity about the Additional Members electoral system used by the Scottish Parliament.
User satisfaction in England was down by 8 percentage points in comparison to Scotland, and 5 percentage points in comparison to Wales. The reasons behind this discrepancy requires further research, but suggests there may be opportunities to improve the experience for users in England in the future. With over 25,000 candidates standing in England’s local elections, our candidate coverage for this nation may have been less comprehensive.
To understand how representative our feedback sample was, we compared the proportion of postcode searches from each nation with the proportion of feedback responses we received during election week. The volume of feedback broadly reflected the distribution of postcode searches. England accounted for the most postcode searches and feedback responses.
| Nation | Postcode Searches | Proportion of Postcode Searches | Proportion of WCIVF Feedback | Proportion of WDIV Feedback |
|---|---|---|---|---|
| England | 3,830,831 | 82.69% | 87.41% | 83.96% |
| Scotland | 498,557 | 10.76% | 9.00% | 15.52% |
| Wales | 296,242 | 6.39% | 3.58% | 10.44% |
Overall, analysing the feedback by nation suggests that users across England, Scotland, and Wales were able to successfully use our services to navigate the elections.
Positive feedback
While the majority of written feedback tends to be critical, the majority of users were satisfied with our services. Here are some positive feedback comments to represent our happy users:
“Easy to navigate site with very clear information.”
“Helpful to have all my local candidate information in one place to look at & to compare plans & policies”
“What a great website!! It is very helpful to access information about candidates in my area all in one place. So helpful - thank you!”
“I found out where to vote and how many people I can vote for. That has made me more confident about voting.”
Get in touch:
Jump into the online chat in Slack, tweet us, or email hello@democracyclub.org.uk.