2025 local elections
This report provides an overview of Democracy Club’s work during the 2025 English local elections.
Summary highlights
- 1.5 million postcode searches in election week.
- 74% user satisfaction on Who Can I Vote For and 88% on Where Do I Vote.
- External partnerships (mainly BBC News and the Electoral Commission) provided over 60% of our user traffic during election week.
- We modified our websites to give information to voters in areas with postponed elections.
- Relaunched ElectionLeaflets.org.
"This website is so accessible and easy to use. Thank you for helping me understand where to vote and who to vote for."
Election overview
24 English councils and four combined authorities held scheduled elections on 1 May. This followed the postponement of council elections in nine other areas, in order to facilitate reorganisation. Consequently, these were the smallest set of local elections since 1975. A full write-up of the elections, including the postponements, can be found on our blog.
Postponements aside, these local elections were a low-key affair, and allowed us to spend time evaluating and improving our existing services, and embarking on new projects. This included a relaunch of our election leaflet database, and the publication of a major new dataset relating to parish and town council elections.
Data collection
Polling Stations
The elections were run by 125 electoral services teams. We received polling station data from all of them, completing this process with a number of weeks to go before polling day. There were also 21 additional areas with by-elections. We proactively contacted these councils, and received data for 16 of them (including both council areas in the Runcorn and Helsby parliamentary by-election). Before 2021, this process was managed entirely via email. In 2021, we launched a portal for councils to submit their data. This year, 81% of councils used the portal.
There were approximately 10,200 unique polling places open on 1 May.
Candidates
Candidate lists were published on 2 and 3 April. We completed data collection on 4 April, with more than 8,600 candidates nominated. In terms of additional candidate information, our database had good coverage for a council election - although we still have a long way to go before we achieve anything approaching comprehensive coverage. We had a photograph of 49% of candidates, an email address for 26%, a statement to voters for 25%, and a social media or other URL for 41%.
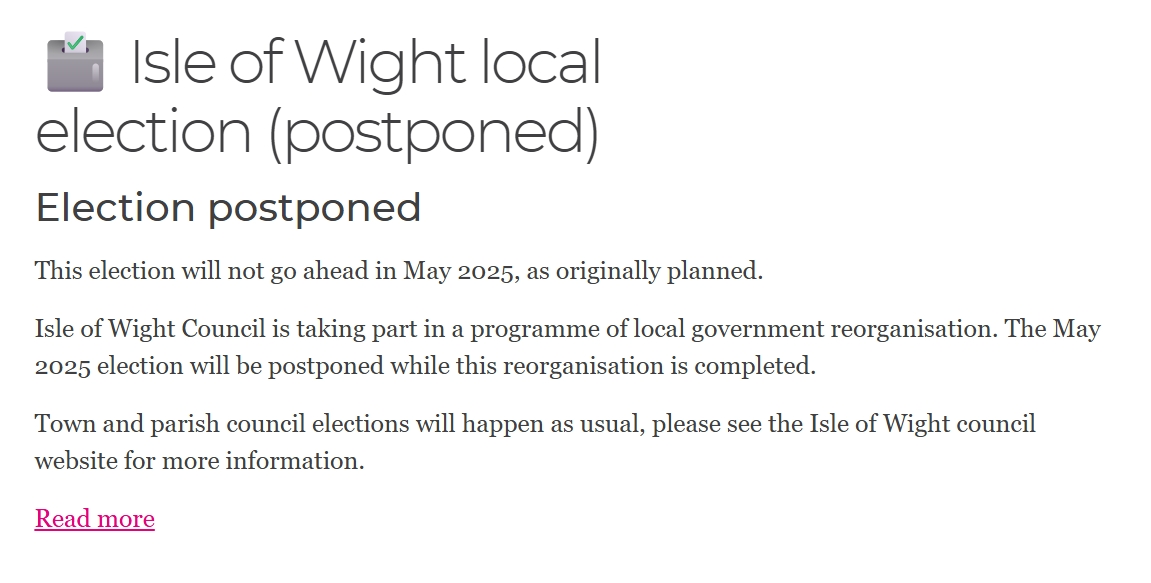
The postponed elections
The postponement of elections in nine areas offered an interesting challenge of how to communicate the situation to voters via our lookups. Liaising with the Electoral Commission, we added text to the affected postcode results on our websites and theirs, explaining the postponement and providing a link to each council’s announcement. A handful of by-elections in these areas introduced some complications, as we were telling users about both the postponed election and the by-election on the same page, something our page layout wasn’t designed to do. This created some confusion, and we will review how we implement this in the future.
Overall, this process has inspired us to think harder about how we communicate the electoral cycle to areas without elections in a given year: our feedback suggests that a number of people believed their elections had been postponed when in fact they had no scheduled elections that year.
Volunteers and the Club
A positive factor this year was the continued increase in the number of candidates who signed up to edit their profiles: at least 1,100 edits during April were made by accounts which identified themselves as candidates, their agents, or political party campaigners. We had 1,011 new user signups in April.
However, this increase in candidate participation has been accompanied by a small decline in signups from new volunteers. The number of volunteers contributing to candidate data collection (specifically on SoPN day) has plateaued over the last couple of years. We will be considering how to tackle this over the coming months, and reaching out to current and former volunteers to understand how the number of people joining and staying can be improved.
Evaluating overall reach and impact
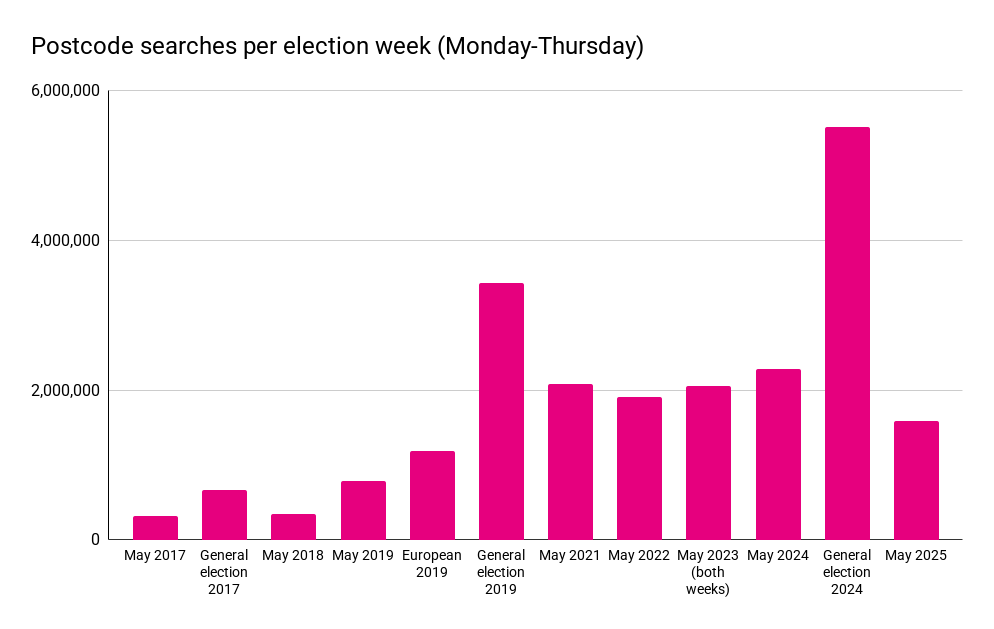
Between 00:00 Monday 28 April, and 22:00 Thursday 1 May, our elections database processed 1,587,973 postcode searches from the UK public. This is the lowest figure since May 2019. However, considering that only a small minority of the country had an election, this was an excellent result. Areas which had elections provided around 50% of our postcode searches over the week, while areas which had their elections postponed gave us 10%.
These election week searches came from the following sources:
| BBC News | 26.7% |
| Electoral Commission | 24.6% |
| WhoCanIVoteFor.co.uk | 21.3% |
| WhereDoIVote.co.uk | 16.0% |
| Democracy Club Widget | 2.4% |
| Other Users | 9.0% |
External sources now account for over 60% of our postcode searches - although this doesn’t account for the thousands of people who navigated directly to their relevant WhoCanIVoteFor ballot page without using the postcode search.
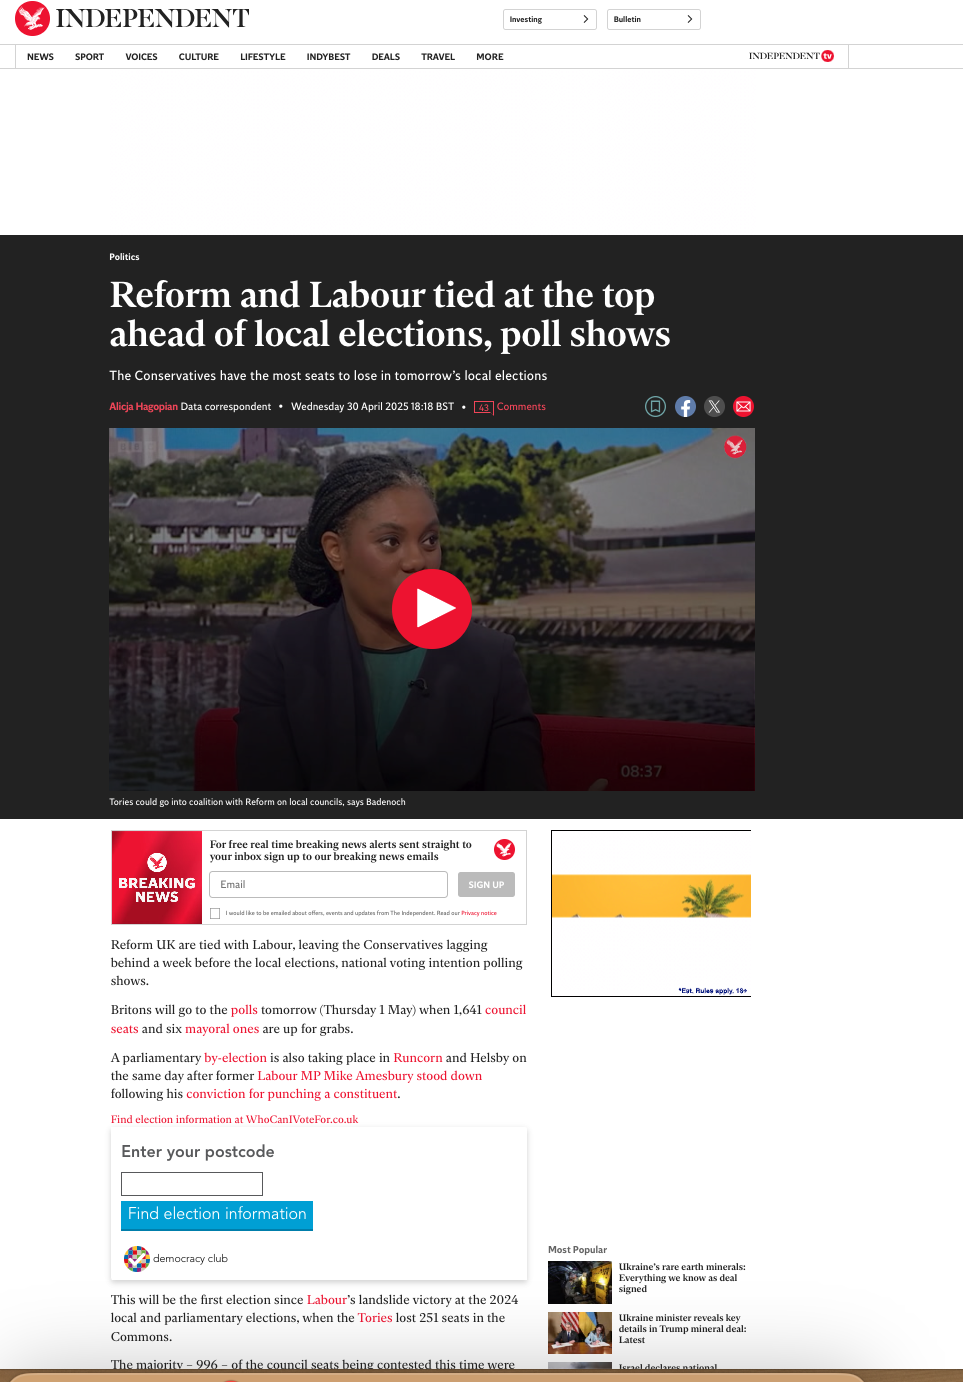
We are pleased to see the continued engagement with our interactive widget - which anyone can embed into their own website. The widget was used by 88 councils (including some councils with postponed elections). The Local Government Information Unit embedded the widget in their guide to the local elections. A number of national and local news outlets included the widget and featured Where Do I Vote in their articles, including the Express and Independent, and it was also added to the website of the Liberal Democrats.
User Feedback
Each election we ask visitors to our sites about their user experience. They’re invited to answer two questions: whether they found what they were looking for, and their likelihood to vote. They are also offered an opportunity to provide written feedback.
From midnight on Monday 28 April until close of polls on Thursday 1 May, 2,428 responses were collected: 1,864 users submitted feedback on Who Can I Vote For, and 564 on Where Do I Vote.
‘Did you find what you were looking for?’
| Source | Responses | Yes |
|---|---|---|
| Who Can I Vote For | 1,864 | 74% |
| Where Do I Vote | 513 | 88% |
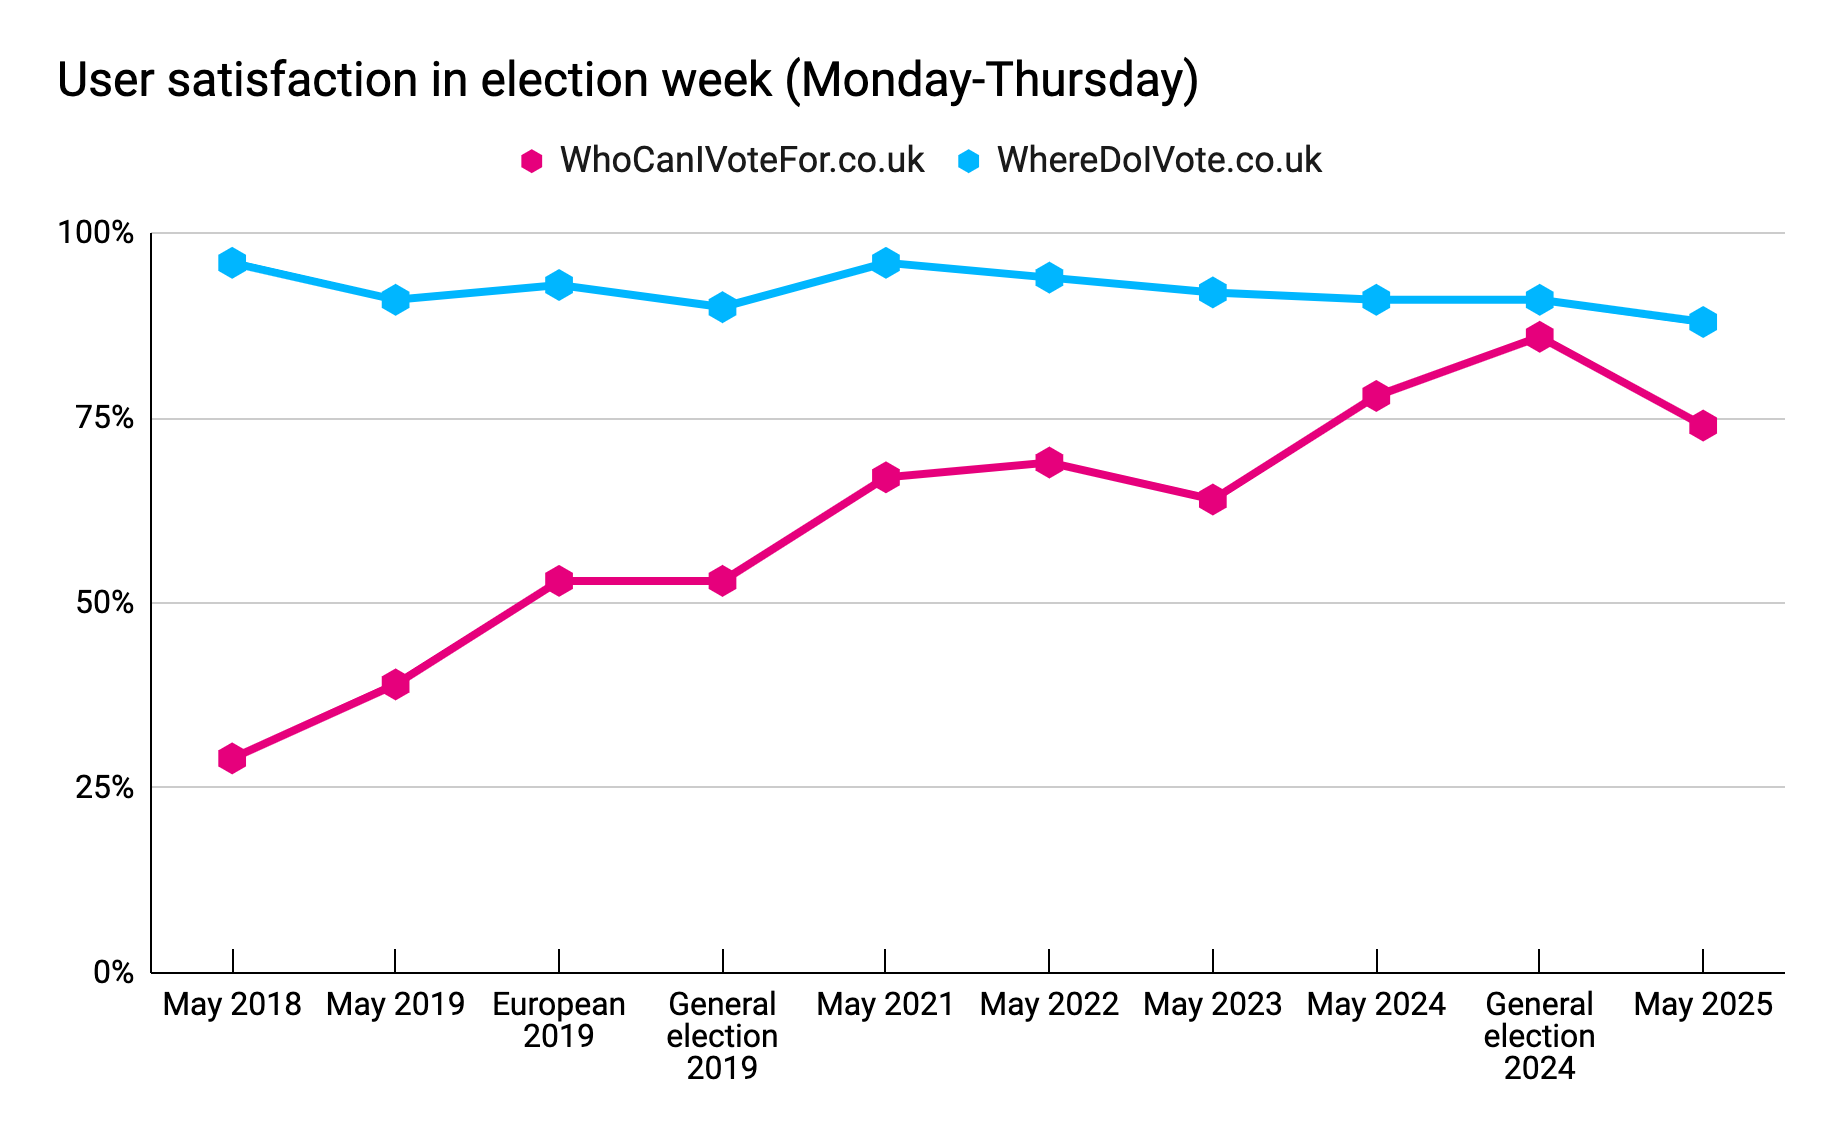
Who Can I Vote For saw a 12% decrease in user satisfaction when compared to the general election, and a 4% decrease from the May 2024 local elections. This is not surprising; the general election saw record satisfaction with a high level of candidate information, while areas with postponed elections dragged down the results as compared with the 2024 locals. Where Do I Vote saw a similar decrease, from 91% in May 2024 to 88% in the most recent local elections. Written feedback suggested a general dissatisfaction with the elections as a whole, rather than our services, although we note that the lack of maps for many polling stations continues to bring negative feedback.
‘Has this information made you more likely to vote?’
A total of 2,008 users responded to this question. Users on Who Can I Vote For were able to choose from three options: 'more likely', ‘less likely’ and ‘I always vote (no change)’. The majority, 1,069 responses (66%) selected 'I always vote (no change)’, while 11% of users selected ‘less likely'. On Where Do I Vote, 78% of those who responded selected ‘yes’, this remains the same as the 2025 General Election, and a 2% decrease from the 80% from the 2024 local elections.
| Responses | More Likely | |
|---|---|---|
| Who Can I Vote For | 1,608 | 359 (22%) |
| Where Do I Vote | 400 | 312 (78%) |
Here’s some happy feedback from users:
"I'd forgotten the venue. This made it easy to find out."
"Everything is transparent, I have nothing to worry about."
"Information on all candidates in one place makes comparison easier."
"It was surprisingly difficult to find information about candidates for the local Oxford elections until I came across this website"
"It clearly told me where I will go to vote, and a link to who I will be able to vote for. The link about helping people with autism to vote was unexpected and really appreciated."
Other projects
Election leaflets
Our major technical project immediately following the general election was the rebuilding of our elections leaflets database, electionleaflets.org. This was possible thanks to a grant from the Joseph Rowntree Reform Trust. The relaunched website allows users to tag leaflets with elections, parties and candidates, and adds significantly improved filter and search functions. The site received over 500 uploads in April 2025 alone, a figure which justifies the effort we have put into maintaining and improving it.
Parish councils
In late 2024 we embarked on a major new research project in partnership with the National Association of Local Councils (NALC). The goal is to collect and publish election data relating to town and parish council elections. The ‘first tier’ of English local government is growing in importance, but has never been the subject of comprehensive research. Working with Democracy Club’s resident parish expert Stuart Orford, we have now published data on the 2024 and 2025 local council elections. We’ve received a large amount of interest in this work, and have plans to publish more data later this year. The lessons learned will also feed through into the rest of our work, as we hope to be able to improve the information about parish councils presented to users of Who Can I Vote For.
Organisational developments
Board changes
In February we announced the retirement of Mevan Babakar from our board of Non-Executive Directors, and the addition of two new members, Jonathan Flowers and Paul Maltby. For the next year the board will be co-chaired by current NEDs Alice and Susan, with a view to appointing a new chair in 2026. The new chair will be a particularly important position, due to our developing relationship with…
The Electoral Commission
In early April the Electoral Commission published its five-year corporate plan. This included a commitment to take our polling station finder in-house by the time of the 2029 general election. Where Do I Vote was our first project, and celebrated its tenth birthday in February.
This is an exciting moment for us, and we’re looking forward to working with the Commission on a smooth transfer. However, it also raises big questions around the future of Democracy Club, as it will eventually result in a reduction of our Commission funding. We are working with our board to establish a new strategy for the next few years, to take us through this inflection point.
Thank you!
Many thanks once again to the amazing volunteers and the electoral administrators who make our work possible. We couldn’t continue to run these services without your support.