Towards better elections — 2021
Executive Summary
This report outlines Democracy Club’s work and its measurable effects during the 2021 elections in England, Scotland and Wales. Notable achievements during this period included:
- Substantial increase in our polling station finder coverage, including all areas in Scotland, Wales, and Greater London.
- High levels of engagement with local government - over 90% of councils provided data, and over 50% embedded our widget/promoted WhereDoIVote.co.uk.
- Significant redesign of WhoCanIVoteFor.co.uk, leading to a fourteen point increase in user satisfaction.
- Addition of Welsh language capability to WhereDoIVote.co.uk.
- Processed two million postcode searches in election week.
- Substantial increase in users of WhoCanIVoteFor.co.uk, and our widgets.
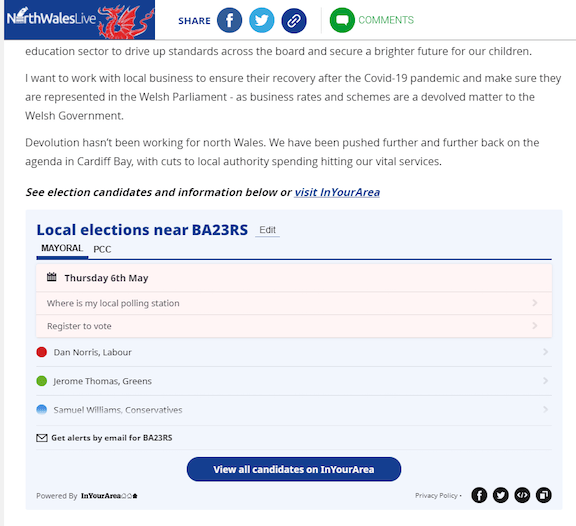
- Secured excellent partnerships with London Elects and Reach PLC’s InYourArea.
- Increased our media footprint, especially through our work with the Fawcett Society.
We also had some disappointments:
- Failed to convince other large media organisations - notably the BBC - to make use of our API.
- Few users of our candidate data, and poor media take-up of our research output.
- Ran out of time to implement some service improvements, notably support for non-First-Past-the-Post election results.
Intro
May 2021 marked the fifth year (excluding 2020) of Democracy Club’s election work, and was the tenth major electoral event the organisation has covered since the 2015 general election, double the number of election days we expected to happen over the same period.
This year continued the trends of expansion and growth Democracy Club experienced during 2019. We achieved our best-ever GB-wide coverage with our polling station finder, WhoCanIVoteFor.co.uk, including all of Scotland, Wales and Greater London. Our candidates data was collected more rapidly and disseminated more widely than at any previous local election. With our two new developers, we were able to implement a large number of site improvements, especially across our candidate look-up, WhoCanIVoteFor.co.uk, and were rewarded with a substantial increase in user satisfaction.
These successes were achieved in the face of considerable problems and complexities thrown up by the coronavirus pandemic. As discussed below, this posed challenges for all areas of our work: our polling station data collection was slowed by councils’ difficulty in securing polling station venues, while the combination of the 2020 and 2021 electoral years inspired modifications and improvements to WhoCanIVoteFor.co.uk. That we handled this situation so successfully was in part due to the stress-testing which our systems had already undergone during the unexpected EU and UK parliamentary elections of 2019: we are looking forward to the resumption of electoral ‘normality’ in 2022!
May 2021 witnessed the most complex polls in recent UK history. With the 2020 and 2021 electoral years combined, the vast majority of areas in England and all areas in Wales held multiple overlapping elections. Voters in Cambridge, for example, were asked to vote for district and county councils, Police and Crime Commissioner, and the local ‘metro’ mayor. We’re pleased to say that our systems handled this context without issue, and we are indebted to the people who volunteered their time to help us identify the 5,000 contested council seats.
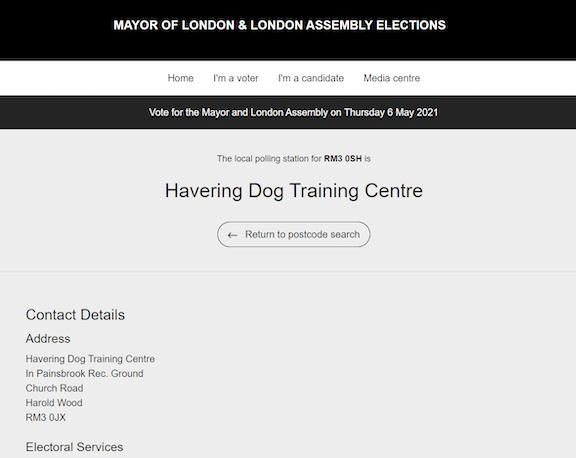
The 2021 elections also saw some significant changes to our operations and reach. Most significantly, WhereDoIVote.co.uk was not linked to by the social media giants, who instead directed users to the website of the Electoral Commission, which uses our API. Consequently, WhereDoIVote.co.uk saw a dramatic fall in visitor numbers, down around 50% as compared to the 2019 local and EU elections, while API use increased substantially. On the other hand, visitors to WhoCanIVoteFor.co.uk increased by a whopping 400% when compared with May 2019.
Our websites also witnessed some significant changes and redesigns in the months before 6 May. These changes were the first use of our new design system, put together for Democracy Club by Heydon Pickering. This will standardise all of our sites with a cleaner, more accessible style and layout. We have already rolled this out across WhoCanIVoteFor.co.uk (alongside a wide range of text and content changes) and our company website, and plan to have it installed across all our websites by May 2022.
Evaluating overall reach and impact
Democracy Club’s user numbers continue to grow. We processed over two million postcode searches in election week. Crucially, however, the majority of these search requests arrived via API, indicating Democracy Club’s position within the electoral landscape is now well embedded.
If 2019 was our ‘breakthrough’ year in terms of user numbers and partnerships, 2021 saw us make significant strides towards improving the quality and comprehensiveness of our services. As discussed below, we substantially redesigned WhoCanIVoteFor.co.uk, and were rewarded with a considerable jump in user satisfaction.
Although the number of our partnerships continues to be small, the organisations we do work with - InYourArea, for example - have significant reach. Similarly, although our media/public relations output remains disappointing, we did score some notable successes this year, especially in our work with the Fawcett society. We’re confident that we have established some excellent relationships with considerable potential for future growth.
Perhaps the most important takeaway from 2021 is confirmation that we have been successful in making change within the state. Not only is the Electoral Commission now firmly committed to maintaining the polling station finder, but the level of engagement with local government is now extremely high: we estimate that 90% of GB councils provided data this year, and over 50% actively promoted our websites or widgets during the election.
Press & PR
Despite the popularity of our tools and services, Democracy Club has historically had a very low media profile. We often struggle to obtain due recognition for our work: for example, although our data on candidates was widely cited during the 2019 general election, we were not approached for comment and in many cases were not referenced as the source of the numbers.
This low profile matters, and not only because it means our volunteers’ efforts go unrecognised. We believe that UK press coverage of elections (especially local elections) is generally poor, while there is little understanding among journalists of the practical problems within the UK electoral system which Democracy Club exists to address.
With this in mind, we took some time before May to speak with PR consultant Gemma Davidson, who assisted us with re-writing our key messaging, as well as offering some pointers on press strategy. We also reached out to a number of organisations about collaborative PR work. We’re pleased to say that our efforts were rewarded with some improvement in our press coverage this year.
Our own research
Our devolved elections lead, Kate, had an article published in Nation.Cymru on the need for greater election accessibility.
We produced a briefing on the English local election candidates, which was widely shared online and received some press interest, including a citation in a Guardian story on ‘hyper-local’ party candidates and by Reach PLC’s InYourArea.
We worked with The Fawcett Society to analyse the proportion of women candidates in the May elections. From our perspective this was an extremely successful piece of work, with Sym’s reflections on the importance of good candidate data widely quoted in the media.
We also partnered with the Association of Electoral Administrators to take a look at polling stations in use on 6 May. This was a last-minute piece of work and received little press coverage, but we’re extremely happy to have made the link with the AEA, and plan to work more closely with them in the future. Crucially, we hope to crack the problem of how many pubs are in use on polling day...
Our data analysed by others
Politics for the Many used our data to identify areas where multiple ‘progressive’ candidates were potentially splitting the vote against a single Conservative, as part of the groups’ campaign for electoral reform.
The House of Commons Library made extensive use of our data in a number of research briefings before and after the election. We had some great conversations about this with them and look forward to advising and working with them in the future.
Library briefings featuring our data:
Areas for improvement
There remains much room for improvement in our PR work. Despite often linking to our postcode look-ups, few newspapers have accepted our offers of help with their election coverage. Journalistic interest in and awareness of non-parliamentary elections remains low, and this is reflected in their reporting. Almost no media outlets correctly reported the number of English council seats up for election, for example, while the Hartlepool parliamentary by-election dominated the coverage).
For our own part, Democracy Club’s online offering in this area could do with considerable improvement. Our website lacks a dedicated press section, and our research output is not signposted for easy access. Our social media cut-through remains negligible, especially when compared with other accounts focusing on election output - this isn’t a problem from a service delivery point of view, but does mean that we are less likely to be picked up by the media.
Next steps for 2022:
- Develop a guide to promoting pre-election information that contains best practice. Promote this guide to the media, and use it to evaluate their election coverage.
- Redesign our corporate website to include clear press & research sections
- Develop a more distinctive research & data ‘brand’
- Prepare more eye-catching shareable data visualisations and graphics for use in our blogs and on social media.
- Reinforce our links with other organisations through the production of more joint-press releases.
The election in data
Polling locations
The first UK election held during a global pandemic since 1918 posed unique challenges for our polling station data collection. With many usual venues closed or in use as testing or vaccination centres, electoral administrators took much longer than usual to confirm their list of stations: at the end of February, for example, one London borough was still short thirty venues. These wider difficulties were compounded by a technical problem affecting Xpress, the UK’s most commonly used Electoral Management Software (EMS). This problem rendered some councils’ data unusable, and although Civica worked quickly to deploy a fix (and followed up with those councils who were experiencing problems), the issue continued to affect our work right up to polling day.
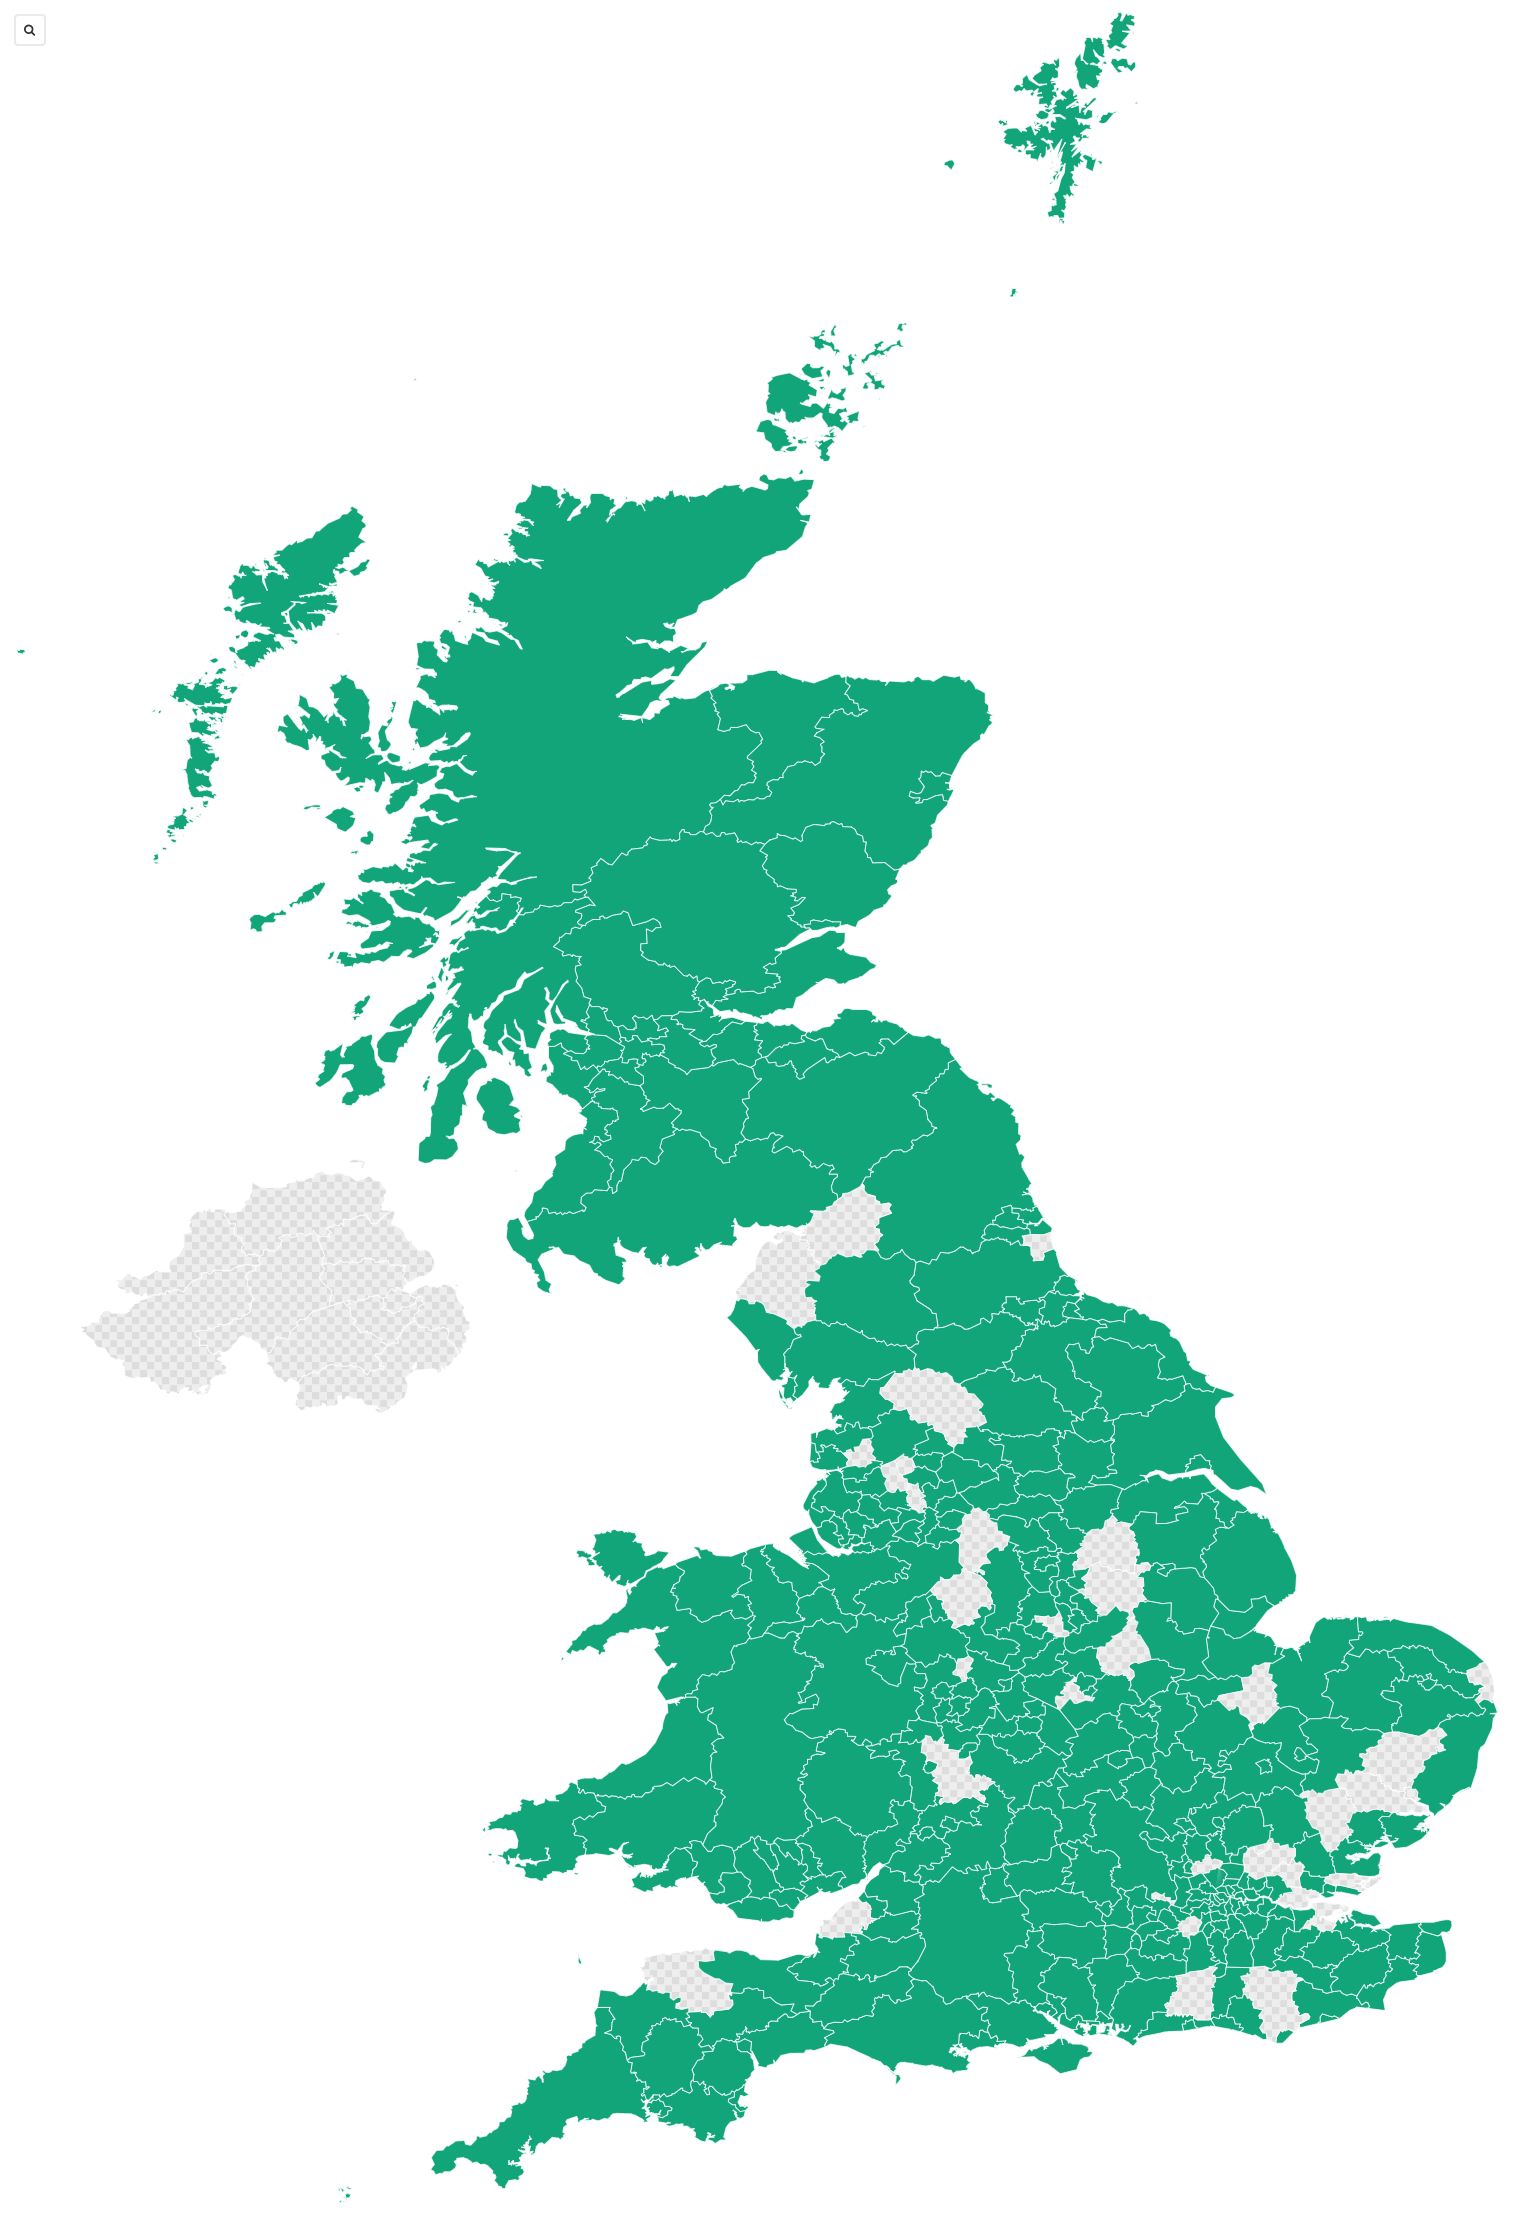
Within this context, we fully expected to fall short of our self-imposed target of 300 (of 371) council areas by 6 May. In reality, we’re delighted to say we completely surpassed it, processing and deploying data for 335 areas, for a total coverage of 93% of the GB voting age population. We’re especially happy to note that his coverage included all areas in Scotland, Wales, and Greater London. This result smashed our previous record of 266 council areas achieved during the 2019 general election, and we see no reason why we will not be able to cover every single area taking part in the 2022 elections.
Key to achieving this result was the fantastic team of people we were able to bring together. This included one full-time and two part-time developers, as well as two people handling the council communications (including one to focus on Scotland and Wales - see below). This gave us the capacity to handle the large amounts of data we gathered: we are especially pleased to say that, with the exception of two late submissions, all council areas were online by the end of April, meaning that the number of users met with a ‘look at your poll card’ message in election week was very low.
Improving our processes
During the Covid-enforced break in 2020, we made two significant changes to the way we handle polling station data internally. The first was the deployment of a bespoke uploading tool, which allows team members handling the data collection to add polling station files directly to GitHub without the hassle of first adding them to online cloud storage. This sped up the overall process while improving communication within the polling station finder team (ensuring, for example, that no files were able to fall through the cracks, which has happened on occasion in previous elections).
The second change relates to our import process. We now lean heavily on the Unique Property Reference Number (UPRN) and Ordnance Survey’s Addressbase to make our checking process quicker while still catching issues in the council-supplied data. The result was a faster import process, with more errors and ‘edge cases’ (for example, postcodes which cross council ward or local authority boundaries) caught and mitigated. Relatedly, we have also put more work into feeding these issues back to councils themselves, hopefully improving the underlying data for future elections.
Expanding partnerships
The other notable development during 2021 was our much closer working relationship with external organisations, notably the Electoral Commission. We held weekly meetings with the Commission’s communications team, who were able to bring in their regional organisers to assist with the collection of polling station data. This had the effect of introducing a wide range of people within the Commission to the practical work of data collection, and we intend to build further upon this relationship in 2022.
During the election we also received help from the Association of Electoral Administrators (who circulated our call for data among their members), as well as the election teams in a number of Combined Authorities - by 6 May, we had all council areas in four of the six CAs holding elections. We were also contracted by London Elects to provide data for their own polling station finder.
Scotland and Wales
In terms of data collection and coverage, Scotland and Wales provided our most radical improvement: both nations had 100% voting age population coverage, up from 73% and 50% respectively during GE 2019.
Wales was largely a problem of communications, as many councils, especially in the North of the country, had never responded to our requests before. Repeated emails and phone calls, from ourselves and the Welsh Electoral Commission team , eventually established contact with all the councils, and we believe that this work will mean our work for 2022 is comparatively straightforward.
The situation in Scotland was much more complex. We had few existing links with Scottish electoral services: previously we have used the data provided by SpatialHub.scot, but, as discussed in our 2019 report, this has been proven to be too unreliable for our purposes.
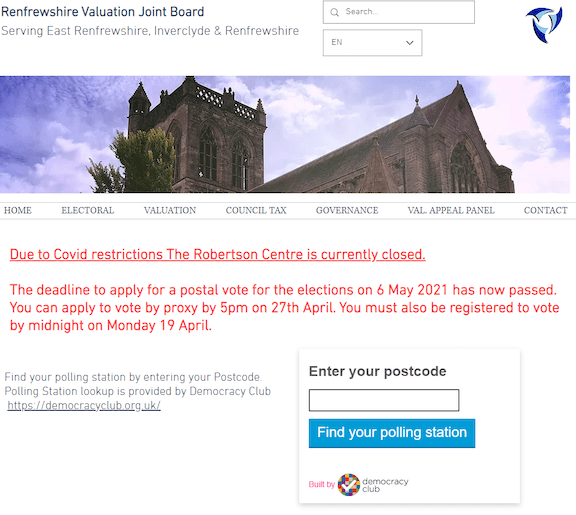
Furthermore, Scottish elections are organised on a different basis than in England and Wales, with responsibilities split between councils and Valuation Joint Boards (VJBs).
Working alongside the Scottish Electoral Commission team, the strategy we adopted was to approach the problem via the VJBs, whose remit often covers more than one council area (for example, Renfrewshire VJB serves Inverclyde, Renfrewshire, and East Renfrewshire Councils). The benefit of this method was that we were able to acquire data for multiple council areas via one point of contact. However, this meant that If we found issues in the data of a specific council, we did not have a clear line to the council’s election team.We also found that multiple council areas were combined in single files, leading to complications when working with the data. Additionally, we had some complaints from councils that the file export process took a very long time, (six hours in one case). As such, although the overall project was a success, we still have some way to go to make Scottish data collection as efficient as in England and Wales.
Areas for improvement
It is clear that, in terms of council engagement, we have convincingly won the battle: the vast majority of councils now provide us with data as part of their usual election preparation. However, the data collection, cleaning and publishing process remains cumbersome, lengthy and ad-hoc, with many councils experiencing delays of up to a month before their data is online. At present we do not hold databases of polling place venues between elections: finding an easy method to do this would substantially improve the speed with which we could deploy the finder.
Next Steps for 2022:
-
Discuss data management options with councils, with the goal of compiling lists of polling stations which persist between elections.
-
Investigate options for improved data collection, either via a self-serve uploader for councils, or a direct link between our finder and Electoral Management Software (EMS). We are in discussion with EMS suppliers regarding the possibility of this.
-
Achieve 100% coverage of GB councils taking part in 2022 elections.
-
Explore the possibility of working with the Electoral Office of Northern Ireland to cover the region for the 2022 Assembly election.
Elections, Candidates and results
Democracy Club’s candidate collection process, if still a little chaotic, is now well-established and benefits from high volunteer engagement. We collected all candidate nominations except English councils within 12 hours of publication, and the 19,000 English council candidates were completed by the following Tuesday. As usual, this was achieved with a very small margin of error (most seriously, a party list was missing from a Senedd regional ballot for a few days due to a confusing nomination paper). Results gathering was similarly successful: through a combination of scrapers and volunteer work, we had collected all First-Past-the-Post election results by 11 May.
Our crowdsourcing site gained some modest improvements in the run-up to 6 May. In terms of user experience, the most significant change was the introduction of geographic (NUTS1 regions) and election-type filters to the front page, elections list, and search functions, which allowed for volunteers to focus on specific areas of interest to them. These geographic filters were also added to our csv download, alongside other new additions such as information on the number of seats contested (so researchers can now identify multi-member ward elections). Improvements were also made to the SoPN upload and locking process (improved candidate and area suggestions, for example). Lastly, all users now have the ability to suggest duplicate candidate profiles for merging, and we hope that this will significantly improve the accuracy of our database for future elections. However, we still need to introduce the ability for users to suggest deduplication of incorrectly merged candidates.
On the other hand we failed to complete other planned improvements, most notably the capability to collect results for non-FPTP electoral systems. For these elections, we simply marked winning candidates as elected, and received a lot of negative feedback about this from site visitors who wanted vote totals.
In terms of data quality, we are still falling short when it comes to providing voters with more detail on their candidates (especially for local elections - see table in Appendix), an issue which continues to be reflected in our user feedback. In part, this is a problem with the amount of information published by candidates themselves, although we are very pleased to note that the number of candidates and agents using our site grew substantially during this year, with some minor parties actively promoting the site to their candidates (see ‘Volunteers and the Club’ section, below).
However, we also recognise that many local parties maintain websites with candidate lists and other information, which we do not manage to collect, and that too many edits come too late in the day (ie. elections week) to be of use to many users, especially postal voters. We are looking into ways to address this. In particular, we will be exploring more robust methods for collecting party information to display on candidate profiles, as the easiest way of getting useful information onto as many profiles as possible.
This year we also spent some time experimenting with two election types we have not covered before: referendums and parish councils (see the section on WhoCanIVoteFor.co.uk, below). We learned some excellent lessons from this work, and established links with the National Association of Local Councils (NALC), with whom we hope to work more closely in the future.
The election in Apps
WhereDoIVote.co.uk
WhereDoIVote’s election was significantly different from recent polls. Most importantly from our point of view as a delivery organisation, we had more councils online, sooner: all but four of the councils we had data for were online before election week. This meant that we received more feedback on the data during the run-up to the polls, enabling us to iron out a few bugs and performance issues before polling day - significantly reducing the team’s stress levels!
Compared to WCIVF, WDIV underwent only modest changes for the 2021 elections. Most significantly, we developed the ability for the site to be translated into languages other than English, and worked with a translation agency to make the site fully available in Welsh. We will maintain the Welsh translation into the coming 2022 elections, and are open to adding other languages, especially in the context of the upcoming London council elections.
Lastly, we also added some extra information to WDIV, relevant for the 2021 elections. Prior to the elections we added cards to the postcode look up which advised people that they would have multiple ballots on the day (with a link to WCIVF), as well as information on how to work at an election (an interesting experiment, which divided opinion among electoral administrators!). We also added information regarding Covid-safe voting to the front page.
Users and impact
With the decision of social media platforms to link to the Electoral Commission website instead, we saw our visitor numbers plummet.Between 3-6 May WDIV received 268,779 individual visitors. This represents 38% of the traffic received over the same period of the 2019 local elections, and a mere 9% of the comparable period for the 2019 general election. This is the first time that WDIV’s traffic has fallen below WCIVF.
In terms of our overall organisational goals of making change in the state, we are very happy with these numbers: this means that the Electoral Commission was the main point of contact for voters during the election. This is how we believe it should be, and something we’ve been working on with them for some time. Another effect was our bounce rate dropping substantially, as we weren’t getting the click-throughs from people on social media who immediately leave the site.
However, the Electoral Commission site itself experienced some trouble during the day, including suffering a crash for around 60 minutes in the morning. Furthermore, because the Commission site did not feature a method for users to report bugs and other issues with the data, we potentially failed to spot as many polling day errors as we might have. We will be working with the Commission over the next year to avoid these issues in the future.
Next steps for 2022
- Bring WDIV within the design system
- Work with the Electoral Commission to implement feedback forms on their own site
- Consider other language and accessibility options in consultation with stakeholders
WhoCanIVoteFor.co.uk
After a long period of relative neglect, WhoCanIVoteFor.co.uk received extensive improvements during the months before May 2021. We reviewed and re-wrote almost all text across the site, redesigned the candidate profiles using our new design system, added new ‘how to vote’ information which adapts itself depending on the electoral system and number of seats/candidates involved, and substantially improved the underlying codebase (see our blog for more detail). We have also redesigned the cards on the ‘ballot view’ pages, reducing the size of images to enable us to fit more on the screen, a modification which particularly benefits mobile users.
For 2021 specifically, we made much greater use of our ‘explainer’ system, adding text and useful links to all non-councillor elections. We gave a unique explanation of the powers of each Mayor, for example, with links to the relevant election websites and PDF information booklets.
These modifications to the site so close to an election did not go entirely smoothly, as the rate of change introduced a small number of issues which took time to fix - problems with text or party logos, for example. We also did not manage to introduce all the changes we would have liked. Notably, planned explanations of the electoral process, descriptions of the roles and responsibilities of elected officials, and an overview of each election type were not added for lack of time.
Hustings, referendums, and parishes
As usual, we collected some hustings information in Google Sheets and displayed these on WCIVF. With all in-person events cancelled, we were able to offer users links to a wide range of online hustings, especially for the English mayoral elections. We had some good feedback on this, with some sites specifically linking to us for hustings information (see, for example, Bristol Student’s Union).
However, this process also revealed the limits of our current hustings collection methods. The Google Sheets themselves were prone to errors, with a number of broken links going unnoticed for some days. Volunteer take-up was low to non-existent, and Democracy Club staff had only a limited amount of time to collect information ourselves. We will review our hustings information ahead of 2022 to see if we can improve on these problems, possibly through collaboration with other organisations.
We also embarked on two experiments in new election types for 2021: referendums and parish councils. By 6 May, in addition to the three initial governance referendums, were also displaying information about two planning referendums. We were also able to offer information on 49 town or parish councils, covering 141 separate wards. However, 43 additional wards within the chosen councils did not match any existing ballots, meaning that coverage of these councils on WCIVF was piecemeal.
We learnt a lot during these experiments, and would like to expand upon them for future elections. We received a number of enquiries from people (including from some principal and district council employees) requesting the addition of more polls or councils, and our user feedback also suggests there is considerable demand for ‘local’ council information on WCIVF.
Users and feedback
As highlighted in our report on the 2019 election, WhoCanIVoteFor.co.uk is now widely used and trusted by citizens, parties, and the UK state. The popularity of the site has grown enormously. Between January-May 2019 we received 264,000 unique visitors. For the same period in 2021 we received almost 1.2 million. Our by-election coverage also receives a respectable level of attention (the two Waltham forest council by-elections on 10 June 2021 each received over 300 unique page views between SoPN and election day, for example). Indeed, despite the suspension of all elections for most of 2020, Google Analytics reports over 230,000 individual visitors between 1 March 2020 and 1 January 2021!
Focussing on the 2021 elections, WCIVF received 593,961 individual visitors, 3-6 May 2021, of which 23% were acquired via referral (indicating we now have extremely strong SEO):
32% Electoral Commission 26% WDIV 18% Facebook 11% In Your Area
Significantly, WCIVF is making converts among local government, too: councils sharing links to the site included Birmingham, East Hampshire, and Shropshire.
We’re delighted to say that WCIVF’s ratings jumped 14% this year, with 67% of election-week users answering the question ‘did you find what you were looking for?’ in the positive. This is a clear endorsement of the changes we made to the site in the weeks before polling day.
Next steps for 2022
- Complete our site improvements to add more explanations (especially for STV elections).
- Review our hustings collection methods with an eye for establishing a more robust database of these events.
- Add governance referendums to Every Election, and explore the possibility of local polls and councils (with the NALC - see data section, above).
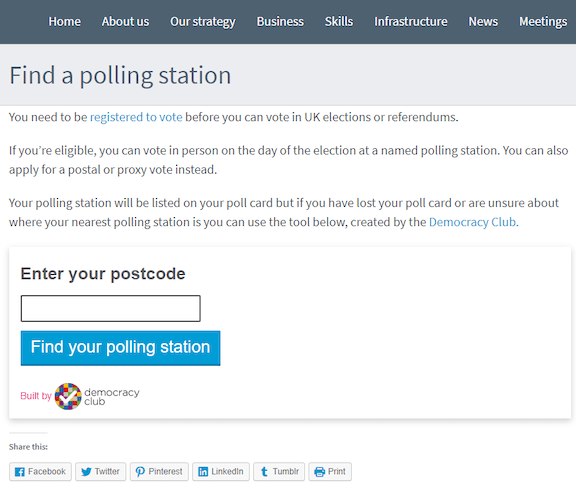
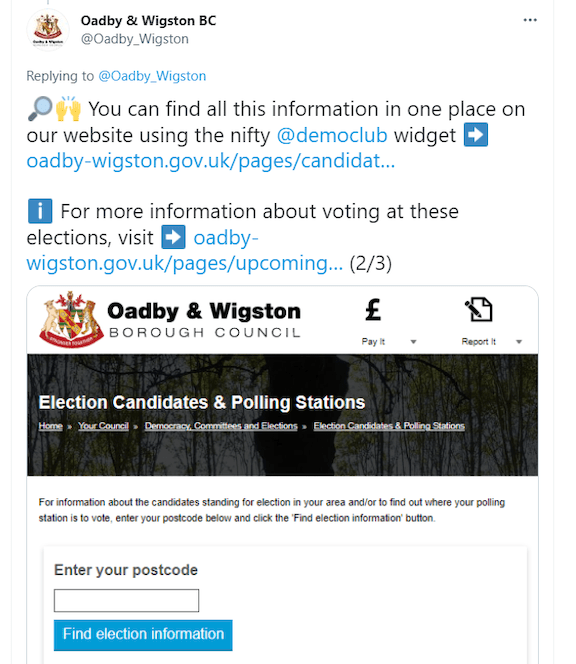
Data/services use and reach
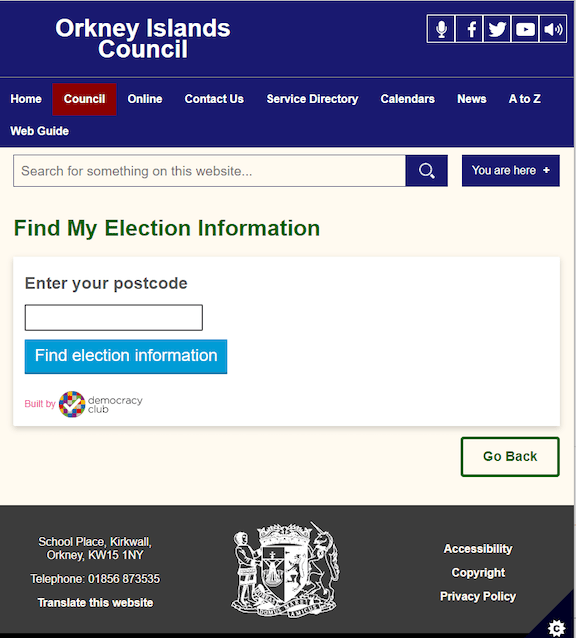
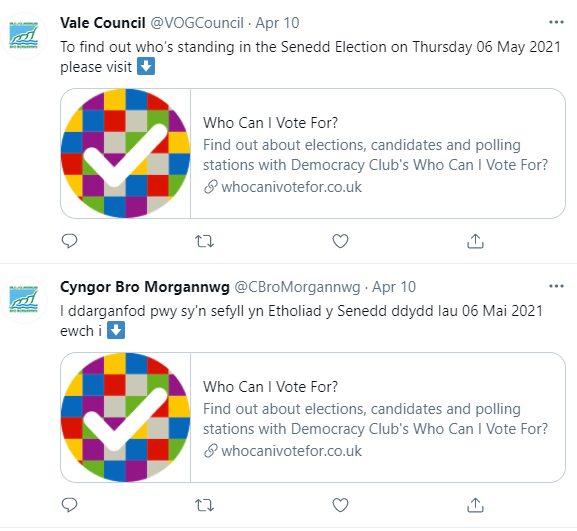
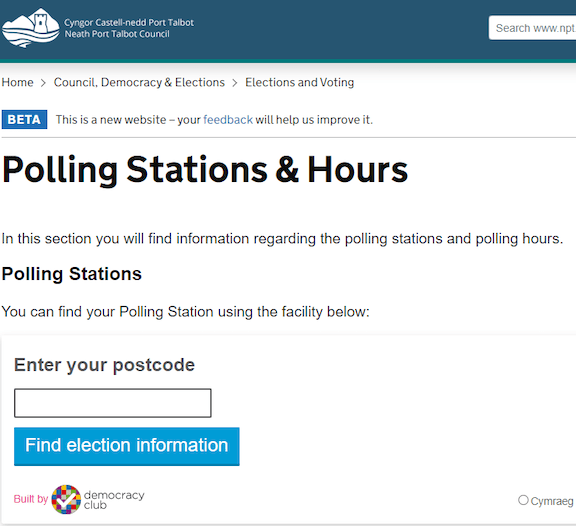
We’re delighted to say that roughly half of all GB council websites either hosted our widget or linked directly to WhereDoIVote.co.uk for the May 2021 elections. Our tracking identifies 60 council widget users (although this is imprecise, and certainly undercounts the number by a significant margin), while an analysis of Google Analytics data identifies at least an additional 90. We’re especially pleased to note that two combined authorities (Liverpool and West of England) embedded the widget, while two others (Tees Valley and West Midlands) linked directly to WDIV. A range of other organisations and political parties also used our API or shared our services, including the Labour Party, Plaid Cymru, The Scottish National Party, and London Real (the party of London mayoral candidate Brian Rose). At least two dozen media organisations linked to WDIV or used the widget.
API use
Our API use presents something of a mixed bag for 2021. On the one hand, we had four major users who provided us with over a million postcode searches on election day alone. These were: The Electoral Commission’s website look-up, the Labour Party’s ‘I Will Vote’ website, Reach PLC’s InYourArea.co.uk, and London Elects’ polling station finder. Our widget also saw widespread use (see below), including from The Times, which ‘forked’ (copied) our tool and applied their own styling, which was then displayed to users of their mobile app during election week. As far as we’re aware, this is the first example of our open-source widget design being used in this way.
Unfortunately, problems with our reporting mean that we are only able to provide API user breakdown for election day itself.
| User | API calls |
|---|---|
| Electoral Commission | 521,632 |
| Labour Party (IWillVote.org.uk) | 276,516 |
| Reach (InYourArea.co.uk) | 175,418 |
| Democracy Club widgets | 124,668 |
| London Elects | 109,593 |
| Times (forked widget) | 1,286 |
| ElectionLeaflets.org | 44 |
Unfortunately, however, we didn’t see an increase in the number of API users, something we had hoped to achieve at the start of the year. We were unable to convince the Scottish or Welsh governments or parliaments to use the API (or our own widget), had no interest in the API from other political parties, and other inquiries from charities did not appear to come to anything. We are also disappointed that no other media organisations explored the possibility of building their own tools using our data, despite the complexity of the elections providing (to our minds) a powerful case for doing so.
CSV use
We had no media users of our csv candidate download for this election. However, it was used by a number of charities and research groups. For example, the Electoral Reform Society and House of Commons Library both produced research using the data. Our results data was used similarly, although we were, again, unable to convince any organisations to make use of this (a number of media organisations we spoke to said that they relied on the Press Association for results - despite PA not being able to offer vote totals, by-elections, or the granular level of detail provided by our database.) We were able to put the data to good use ourselves, however, displaying an interactive graph of results on the front page of WCIVF in the weeks after the election.
Widget
We’re pleased to say that use of both our widgets continues to grow at a rapid rate. The number of postcode searches processed by our two widgets has jumped from roughly 40,000 during May 2019, to 108,000 across the week of the 2019 general election, to 125,000 on election day alone in 2021.
Widget users this year included a wide range of civic engagement organisations, charities, and at least one major political party (Plaid Cymru). However, postcode searches have mainly been driven by widespread adoption of our tools across local government. Our election widget in particular really came into its own this year, as administrators faced the serious challenge of communicating the number of ballot papers each voter would be handed on 6 May. We received some great feedback and praise from elections teams, who value the interactive capabilities and ward-specific detail which our widget can add to their websites (our widget is also WCAG compliant, meaning that it fits in well on most government sites). Indeed, a number of councils added new pages to their websites solely as a place to host our widget, for which we are enormously grateful!
We’re especially happy with widget take-up in Wales, where 10/22 councils made use of it on their sites (with the Welsh language toggle). In Scotland we had much less success, a situation which possibly reflects a wider issue with voter information across the country. By our count only four Scottish councils embedded our widget (plus at least one VJB), one linked to the Electoral Commission polling station finder, and at least four others had their own finders. This left the majority of Scottish councils without any kind of interactive polling station finder that we could identify. Take-up in England is less easy to measure (due to the number of councils and inaccuracy of our logging), but we have identified at least 52 English councils who embedded one of our widgets.
Volunteers and the club
As usual, we wouldn’t have been able to achieve our level of candidate and elections coverage without our volunteers. Democracy Club’s Slack now contains over 800 people, while our candidates database has almost 11,000 user accounts. Of the latter, 2,370 (12%) were created in 2021, the largest number of new users for any of the elections the site has covered (although only 1,817 of these new accounts went on to contribute an edit).
Among these new users were a number of new ‘Super Wombles’, expanding our pool of dedicated, high-contributing users and thereby providing greater resilience to our data collection efforts. During April and May, eleven volunteers each contributed over 1,000 edits to our candidates database. We also continue to have a high level of volunteer engagement with by-elections.
One significant development this year has been the growth of candidates and election agents editing their own profiles or those of the candidates they are responsible for. Measuring this engagement precisely is difficult, but a rough picture can be gained by looking at edits where the source is given as ‘I am the candidate’. Between January and May 2019, 578 database edits were made with this source. For the same period in 2021, this figure had jumped to 1378 (despite there being fewer candidates in 2021). This is a tremendous improvement, and shows how Democracy Club is smacking progress and raising its profile among political parties and candidates.
However, this increased level of engagement brings with it problems of oversight, especially in terms of catching vandalism attempts (we do not moderate edits unless they are vandalism attempts). At present, we monitor edits via a dedicated Slack channel, but this year we struggled to keep up with the rate of change. We intend to create a more robust monitoring system for future elections.
Governance, finance and operations, 2020-2021
Following the departure of two core team members after the 2019 general election, and the suspension of all elections due to the coronavirus pandemic, Democracy Club spent much of 2020 operating with a skeleton crew. The only significant development during this period was a refactoring of our polling station finder.
However, we were able to secure extensions from our funders, in particular a 12 month extension from JRCT to the value of £50k to continue with candidates and to spike a representatives project. This meant that the Company was in a strong financial position heading into the 2021 elections. This allowed us to scale up quickly for the 2021 elections, re-employing two former staff members and hiring four new people. Of these six, three were employed for the election itself (two developers to assist with writing polling station import scripts, and one elections assistant to help with communications), while the other three are now full-time members of the team for 2021/2022 (including two developers). This will allow us to make significant improvements to our services well in advance of next May’s elections.
Acknowledgements
The fantastic success of our polling station finder would have been impossible without the sterling work of our temporary elections staff: Alex, Kate, and Sean, who ensured that we not only gathered more data than ever before, but had it all online a week before polling day.
Andrew Teale and Stuart Orford provided invaluable help counting by-elections and checking our final list of seats and wards; Stuart also did much of the work collecting parish council information.
As ever we are grateful to our funders for supporting our work.
Finally, thanks as always must go to our incomparable community of volunteers, who broke all the records this year for the speed and accuracy of their data collection and checking.
Appendix 1: WhoCanIVoteFor.co.uk data quality
| Election | Images | PPC Page | Facebook Personal | |||
|---|---|---|---|---|---|---|
| All | 38.88% | 25.57% | 19.67% | 14.73 | 16.96% | 5.32% |
| senedd.c.2021-05-06 | 85.06% | 59.74% | 62.99% | 23.38% | 44.16% | 13.96% |
| senedd.r.2021-05-06 | 68.40% | 43.56% | 50.92% | 15.64% | 34.44% | 13.80% |
| sp.c.2021-05-06 | 88.52% | 79.27% | 71.99% | 26.61% | 53.50% | 9.52% |
| sp.r.2021-05-06 | 69.61% | 47.22% | 53.35% | 19.26% | 31.81% | 8.99% |
| gla.a.2021-05-06 | 68.42% | 40.94% | 51.46% | 30.41% | 26.32% | 18.13% |
| gla.c.2021-05-06 | 91.03% | 75.64% | 83.33% | 46.15% | 50.00% | 21.79% |
| pcc | 98.80% | 77.71% | 71.08% | 29.52% | 64.47% | 15.66% |
| Mayors | 97.73% | 73.86% | 84.09% | 28.41% | 60.23% | 15.91% |
| Locals | 34.27% | 21.88% | 14.91% | 13.73% | 14.14% | 4.49% |
In addition to the above, 18% of candidates across all elections had an election statement attached to their profile.