Towards better elections — 2019
Executive Summary
This report outlines Democracy Club’s work and its measurable effects from 1 June 2018 to 1 June 2019.
This period included by-elections throughout the year, scheduled local elections on 2 May and scheduled-but-unexpected European Parliament elections on 23 May. Democracy Club reports annually, based on what we call the ‘election year’, which assumes that there are always scheduled elections at the beginning of May.
Our achievements included:
- maintaining national data infrastructure on elections for another 12 months, coping with an enormous set of local election candidates and making nearly 100,000 edits to candidate data over the year;
- introducing automated data capture from official nomination papers, which sped up the volunteering process;
- building a combined API to make it easier to reuse elections data — with new partners such as Reach PLC’s In Your Area website;
- covering over 75% of the May local elections electorate with polling location data (though this was down on last year);
- serving data over 2,000,000 times across our own websites and those of partners, in order to help people take part in the democratic process;
- establishing and demonstrating the feasibility of producing open data on elected representatives (notably councillors);
- our highest ever user satisfaction ratings for WhoCanIVoteFor.co.uk at the European elections, and a 16-point rise in user satisfaction for the local elections.
We had some notable failures this year too:
- not convincing the BBC to use our polling location data to run a finder on the BBC website, despite innumerable meetings, (and the BBC also continued to use inaccurate election data);
- the rate at which we could provide information to voters beyond simply a name and party for local election candidates was not much different than last year (though impressive in absolute figures) — and user satisfaction on WhoCanIVoteFor.co.uk is still relatively low;
- we were unable to convert any significant number of the hundreds of thousands of people who viewed our donation requests on WhoCanIVoteFor.co.uk and WhereDoIVote.co.uk
Our plans for 2019-2020 are detailed below. In brief, assuming a similar level of resourcing to this year, they include maintaining election data throughout the year and through the scheduled local, mayoral, devolved and police area elections in May 2020. We will remain prepared for any snap general election or referendum. We also plan to step up advocacy work to press public institutions to take on some of the data infrastructure.
You can help by donating to the club or volunteering your time. We work openly and always seek feedback on our work and plans: you can see our current and future workplans on Trello.
Please signup to the mailing list, join us on Slack, message us on Twitter or Facebook, or email us via hello@democracyclub.org.uk.
Vision and Mission
This year the board established a new vision and mission statement.
Our vision is of a country with the digital foundations to support everyone’s participation in democratic life.
Our mission is to create those foundations by:
- Identifying areas for improvement in democratic engagement;
- Ensuring everyone has access to quality information on democratic processes, particularly on elections;
- Mobilising a non-partisan movement of volunteers for democracy.
Review of the Year

At the beginning of this election year, June 2018, we set ourselves a range of goals, relating to the social impact we aim to have. Our goals are meant to contribute to our overall social impact, which we list as:
- Civic expectations of access to information about elections are met;
- Citizens feel better informed about elections, democracy;
- Sustainable increase in engagement with candidates or the elections process;
- Sustainable increase in turnout at elections;
- Sustainable improvement in trust in democracy; and a
- Sustainable increase in engagement of groups less likely to take part in democratic process.
- While we cannot show that our efforts this year lead to those outcomes, they serve as a reminder of our purpose. We hope to continue to work with evaluation and research experts to better understand our social impact.
Goals met or partially met
Better use of volunteer time; more diverse volunteer-base, and more data… [and a] five percentage-point increase in satisfaction at WhoCanIVoteFor.co.uk*
In terms of better use of volunteer time, the year included a significant amount of technical work to improve the codebase of Candidates, our candidate-data crowdsourcing website.
For the first time, we were able to automatically convert some of the official documents on election candidates (published as PDFs on council websites) into machine-readable data. This increased the productivity of volunteers: rather than have to copy-and-paste data, they can now simply check the robot’s collection efforts. It increased the speed with which we got to full coverage of name and party data and freed up volunteer time to look for other useful information about candidates.
In terms of a more diverse group of volunteers, we do not survey the volunteers, but throughout the crowdsourcing period it did seem as though more candidates, campaign managers and local party representatives were involved this year.
Our goal of ‘more data’ was met simply by virtue of their being over 26,000 candidates standing at the local elections, but we had hoped to have more than only name and party information for a higher proportion of candidates this year. At the local elections, we had at least one contact detail for 20% of candidates, which was a drop of three points from last year. However, we did better on statements to voters (11% of candidates had a statement this year vs 8% last year) and better on photos (20% vs 15% last year).
For the local elections, the satisfaction score for Who Can I Vote For? was 38%, up 16 percentage points on last year. At the European elections, the satisfaction score was 52%, which may be partially explained by the fact we had information beyond name and party on nearly 90% of around 600 candidates.
Two million uses of data via API-partners/our websites/widget at May 2019
We did meet this target, but largely because we there were over a million requests around each set of elections: local and European. Of the outputs we thought would get us there, we worked to develop partners to reuse the data. Another planned output was an ‘ElectionEverything widget’ (i.e. a combined polling station information and candidate information for any website), but this did not happen, due to an over-reliance on volunteers and pro-bono work. It remains on this year’s goals list with a different approach.
90% coverage of 18+ population with polling location data for elections in May 2019
For the local elections, 178 councils sent us their polling location data. We imported it all, but this number was some way short of the total number of councils holding elections. This meant that we covered 76% of the 18+ population for the local elections.
For the European elections, more councils sent us data than we had a chance to import in the short time available. This meant we could cover 58% of the 18+ population. We will consider the lessons from this for any snap general election and for the long-term goal of achieving 100% coverage.
Several outcomes relating to the ‘club’: better public understanding; 15,000 on the mailing list; 500 volunteers adding data; better funding; 75 monthly small donors; a more diverse group of volunteers
Various outputs were planned to meet this goal. In brief, we did clarify the club’s vision and mission, create greater board involvement and we did successfully fundraise to support the status quo, though not for expansion. The mailing list grew to 20,000 and we had over 1,200 volunteers add data.
We failed to meet the individual small monthly donor target, despite our bright-coloured requests on our voter information websites, nor did we sell a polling location finder to a council. We also failed to survey the members to judge diversity, though some progress was made with the survey design and this would be a priority for any new ‘organiser’ hire.
Better awareness of issues facing groups currently less likely to take part in democratic process
The output here was to produce a report on under-participating groups, a draft of which was published. This work is guiding some of the suggestions we provide to other organisations and funders, and we plan to develop an executive summary of tasks or tactics from it over the next year.
50,000 uses of a lookup-your-representative tool; 500 downloads of a representatives CSV
This was a stretch goal. The main planned output was a discovery process on councillor data, which we carried out in October 2018. We identified an appetite for open representatives data and established that it could be produced and managed inexpensively. The question is now more about resourcing: making the data available in a way that is accurate, accessible and sustainable.
Goals not met
Polling station finder on BBC News homepage on May 2019 election day
This goal was not achieved, though not for want of trying. While there were many meetings with BBC News staff, nobody took the lead to arrange the small amount of development work necessary to add it to the BBC website. Relatedly, in a blog at the time of the local elections, we showcased some examples of where the BBC published wrong information to voters. Our WhereDoIVote.co.uk website was at least linked to from the BBC News liveblog on the election days.
10,000 reminders sent for May elections; 20% survey respondents say they wouldn’t have voted without it
We had hoped to begin work on an Election Reminders service, but little progress was made here. We planned to start with a discovery process on user needs, technical requirements and sustainability. We remain cautious about the project without a plan to measure its effect and without a route to sustainable funding.
Help improve other institutions working on democratic engagement in the UK
The outputs we hoped to produce here were a report or event on The Electoral Commission and voter information, as well as a report on ‘what good looks like for digital+democracy in the UK’. Neither of these were produced, but importantly, we maintained conversations with the commission and contributed to some of their internal documents throughout the year. The Constitution Unit at University College London published a report on voter information that is highly relevant to our work: Doing Democracy Better.
Goals that did not apply
In the event of a general election, help 10m people gain knowledge about election
There was no general election, but we maintained a plan for an unscheduled election, which included listing and preparing potential freelance hires and sources of funding. This work will continue through next election year as necessary.
The Year In Data
Elections Data
Coverage
We are confident that we covered every scheduled and unscheduled election of district council level and above for 2018-2019. We have now done this for over 18 months.
This data is crowdsourced with the help of robots that monitor political discussion boards and local authority websites.
Partners
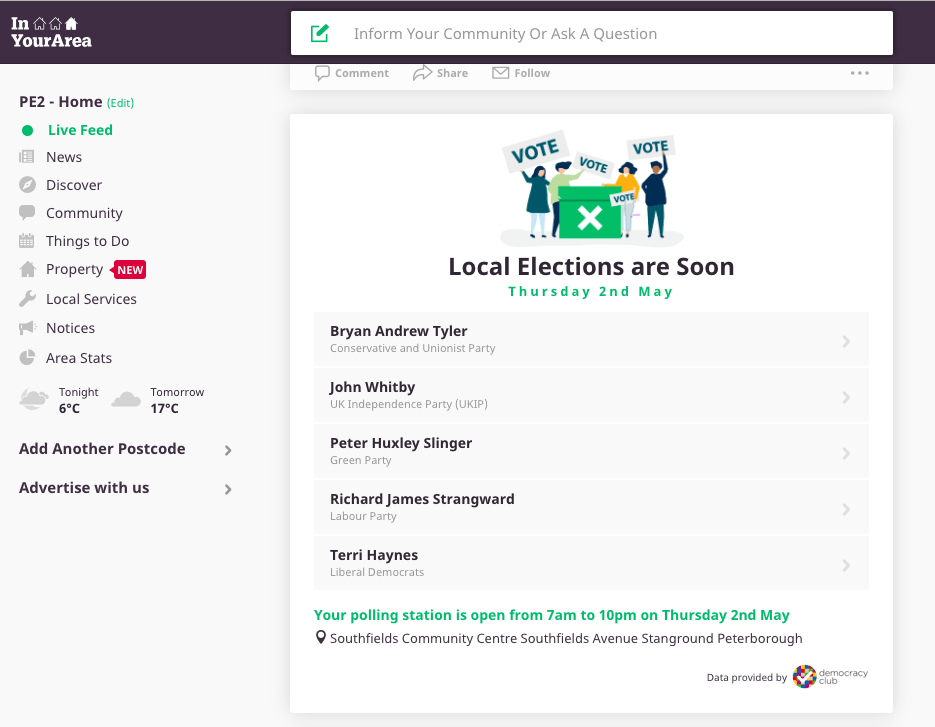
Around scheduled elections, our elections data is used by The Electoral Commission on YourVoteMatters.co.uk, as well as by Reach PLC (owner of many local newspapers) for their “In Your Area” website, a kind of local news and marketplace live feed.
This year no partner used the by-election data, but we began conversations to provide ongoing by-election data to aid a new voter registration product for university students.
Reach/use
The elections dataset was used every time a postcode lookup was made via a Democracy Club service. This means the elections data powered over two million data uses.
Analysis
This was our first full election year where all local elections were covered.
The partnership with Reach PLC was our first nationwide news partnership to use local election data served at the local level. We hope to enter into more partnerships of this kind.
Given our ability to cover all elections, there remains a good opportunity to create an election reminders application. However, this hinges on our ability to pay for it and to test its effect.
Our scheduled elections data is more accurate than that used by BBC News: ours covers by-elections, ours checks that each ward in a council area in fact does have an election, rather than assuming all do, and our system can deal with countermanded or cancelled elections. We will continue to advocate for the use of our data to better serve citizens.
Candidates Data
Coverage
We collected candidate data throughout the year for every by-election: 767 different individuals, some of whom stood for more than one election.
We recorded candidates data for every scheduled election and by-election on 2 May 2019 — around 26,000 candidates. For the local elections in May, we recorded at least one contact detail (any social media presence or email address) for 20.8% of the candidates (vs 23.5% in 2018). We had statements (text from the candidate explaining why voters should give them their vote) for 10.8% of candidates (vs 8% in 2018) and a photo of 19.9% of candidates (vs 14.7% in 2018).
We also collected data (email addresses, websites, social media accounts) on local branches of political parties, in an effort to provide some more information to users, which seemed particularly important where there was no additional information available about a candidate.
At the European elections, we collected data on 591 candidates. We had at least one contact detail for all but 79 candidates, although because voters (except in Northern Ireland) voted for a party rather than a candidate, this may have been less important than at the local elections. We also collected the major parties’ European election manifestos, where they were available.
Partners
For the scheduled local elections on 2 May, the candidates API was used by The Electoral Commission to power a list of names on the YourVoteMatters website. As above, a new partnership with Reach PLC saw them also publish local candidate information to their users.
These partnerships remained in place for the European elections, though with information on parties rather than candidates, due to the voting system used.
There may have been many other organisations using the data via the CSV download, but we do not currently track usage here.
Reach/use
This year we moved to a combined API that gave access to both candidates data and polling locations data with a single postcode lookup. This means that a user may have been looking for candidates information, but will have received both candidates information and polling location information. Below we simply count all uses.
Around the local elections, the total number of uses of candidates data was around 530,000. Rounded to the nearest 5,000, this was made up of: 265,000 uses of WhoCanIVoteFor.co.uk, 155,000 uses of Your Vote Matters and 110,000 uses of In Your Area.
Around the European elections, the total number of uses of candidate data was around 680,000. Rounded to the nearest 5,000, this was made up of: 170,000 uses of WhoCanIVoteFor and via 340,000 uses at Your Vote Matters and 170,000 uses at In Your Area.
We cannot track the reach of the CSV downloads.
Analysis
The scheduled local elections saw the largest group of candidate details we have ever had to crowdsource. It was thus convenient that we were able to introduce some level of automatic conversion of name and party data from official documents, which sped up the volunteering task considerably.
We are still at a relatively low level of additional information on candidates (i.e. anything beyond name and party) even though the absolute numbers of bits of useful data collected were high this year.
While there may always be a number of ‘paper candidates’ — those who stand simply to get a party name on the ballot paper but do not actually campaign — we should be able to improve on the proportion of candidates with contact info and/or a statement to voters in future. Improvements to both the Candidates website and to our communication with political parties are priorities.
In terms of data use, we aim to add some kind of survey alongside the CSV download in order to understand who is using the data and why.
Polling Locations Data
Coverage
From a total of 249 councils with scheduled local elections in May 2019, 178 councils sent us polling location data or provide the data via an API. We imported all of this data and thus estimate that we covered 76% of the 18+ population (if excluding Northern Ireland, which has its own finder provided by the Electoral Office for Northern Ireland, or 71% including Northern Ireland). This is down on the near 90% achieved last year.
From a total of 371 councils with European elections in May 2019, i.e. all of England, Wales and Scotland (again, Northern Ireland has its own finder), 251 councils sent us data or provided the data via an API. As explained below, we were unable to import all of the councils’ data, and estimate we covered 58% of the 18+ population (exc. Northern Ireland or 56% inc. Northern Ireland).
We do not currently have the resources to provide the polling location finder for by-elections without payment from local councils. We outline this offer on our website, but no council took us up on the offer in this election year.
Partners
For both sets of elections, The Electoral Commission’s Your Vote Matters website, Reach PLC’s In Your Area and the Labour Party were partners that consumed the data. We also ran WhereDoIVote.co.uk and the polling location finder widget.
Reach/use
Around the local elections, the total number of uses of the data was over 1,100,000, roughly equally split between WhereDoIVote.co.uk and from API users.
Rounded to the nearest five thousand, the API use at the local elections was made up of:
| API | Users |
|---|---|
| WhoCanIVoteFor.co.uk | 255,000 |
| Your Vote Matters | 155,000 |
| In Your Area | 110,000 |
| Labour Party | 30,000 |
| Widget | 20,000 |
| Others | 5,000 |
Around the European elections, the total number of uses of the data was nearly 1,300,000, of which 900,000 uses were between 10pm on 22 May and 10pm on 23 May. This time, the split between WhereDoIVote.co.uk and the API users was around 475,000 and 797,000 respectively.
Rounded to the nearest five thousand, the API use at the European elections was made up of:
| API | Users |
|---|---|
| Your Vote Matters | 340,000 |
| WhoCanIVoteFor.co.uk | 220,000 |
| In Your Area | 170,000 |
| Labour Party | 40,000 |
| Widget | 20,000 |
| Others | 10,000 |
Analysis
We had a lower level of coverage for the scheduled local elections this year. We are not entirely sure why. Not all councils send us data, partly due to software issues (there are only four electoral management software systems, and only three can export the data we need).
The European elections were the first occasion in which we have been provided with more data than we could import. This was due to the short timeframe between the announcement of the elections and polling day: there was not sufficient time to clean and query anomalies in the data that is necessary to reach a level of accuracy we were happy to make public.
In the next election year, we will outline how coverage for the finder can be increased to 100% over time, and hope to work to develop a plan to meet this goal working with stakeholders such as The Electoral Commission.
Results Data
Coverage
Thanks to the quietly efficient work of a small group of Democracy Club volunteers, we have typically had results for every by-election entered into the system within hours of their declaration, over the year.
Partners
There were no external partners who used the results data.
Reach/use
We consume results data on our Who Can I Vote For? service, as we find that a small proportion of users return to the site after the election to learn who won. For example, following the scheduled local elections, there were 24,000 visitors over Friday 3 through Monday 6 May.
Analysis
Typically, UK news media organisations simply report on the numbers of councillors elected and control of the council. While this is important, it is not hard to imagine that voters would like to easily be able to find out the name(s) of their new local councillor(s) shortly after the election.
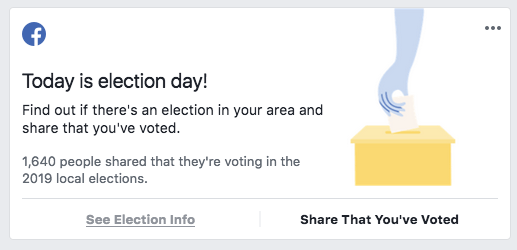
We thus hope to encourage wider use of election results data by partners such as Reach PLC’s In Your Area, BBC News or Facebook. The latter did use 2017 General Election results, providing users with information via a “You have new representatives” product in their users’ newsfeeds, but they have never engaged with data regarding the local elections in this way.
The Year in Apps
We run websites that consume the open data we produce: WhoCanIVoteFor.co.uk and WhereDoIVote.co.uk, named after the most popular online searches on election days.
WhoCanIVoteFor.co.uk
Use
WhoCanIVoteFor.co.uk shows by-election and by-election candidate information all year round. The website received 41,000 visitors from June 2018 through to the end of the year, an average of 1,350 visitors per week.
As the local elections approach, the traffic increases. From January 2019 through to the weekend after the local elections, there were 264,000 unique visitors to WhoCanIVoteFor.co.uk, some 165,000 of them arriving in the week of the local elections.
From Monday 6 May to the weekend after the European elections, there were 172,000 unique visitors to the website, 120,000 of them arriving in the week of the elections.
The website is increasingly linked to from council websites, as well as all kinds of media or community organisations, including a mention in the BBC News liveblog, tweets from Dazed magazine, and posts in local community groups on Facebook.
Feedback from users
From the start of the year to 5 May, a period in which most users were presumably looking for local election information, we received 11,363 bits of feedback and a satisfaction score of 38% (i.e. 38% of those who gave feedback tapped on or clicked the thumbs-up icon). While it is disappointing that a large majority were not satisfied, the number is a strong improvement on 22% the previous year. Either users’ expectations fell or we managed to provide more of what they were looking for.
From 5 May to 31 May, a period in which most users were presumably looking for European election information, we received 2,687 bits of feedback with a 52% satisfaction score, the highest we have ever achieved. This is presumably down to there being fewer, but more high-profile candidates, or perhaps because the electoral system gave people a broader choice.
We analysed some of the qualitative feedback on WhoCanIVoteFor.co.uk in this blog post. In short: voters were looking for information, such as candidates’ positions, on Brexit; some voters assumed that the service was provided by the government; and some were looking for information we did not provide.
WhereDoIVote.co.uk
Use
From midnight Monday 29 April through Thursday 2 May, the week of the local elections, the website saw 707,000 unique visitors, with most traffic coming from the link in the Facebook newsfeed.
From midnight Monday 20 May through Thursday 23 May, the week of the European elections, the website saw 816,000 unique visitors, again with most traffic from Facebook.
Many local authorities now link to the site too.
Feedback from users
For those users who we were able to serve with an answer (a polling location), we collected 11,388 responses over 20 May through 23 May with a 93% satisfaction rate, a small reduction from last year’s 96%. We assume that those who do not receive a polling location will be unsatisfied.
The dip in satisfaction among those who did find their polling location may be as a result of the Facebook link to ‘See Election Info’: users may have expected more information than only a polling location.
The reason we seek partnerships with Facebook et al is so that we can push information to people who may not have looked for it proactively. We saw some good anecdotal feedback of this happening:
“I wasn’t aware that the vote was today. Great job letting me know and giving additional information i.e where to go, what I need etc”
“I wasnt aware there was a vote until I saw it on FB”
“Super helpful, I might not have bothered voting without this info!”
Simultaneously, we also found we had more comments from people who did not find the site helpful, because they either already knew where to vote, did not plan to vote or were not registered. These people would not have independently sought out the site, and left feedback such as:
“Not registered”
“Already had this information thanks.”
“Voting is a waste of time”
Polling Location Finder Widget
This widget allows any website owner to help their users find out where to vote. It’s powered by our data.
This year, we recorded 18,524 uses at the local elections and 19,526 uses at the European elections.
The Year in Labs
Representatives Data Discovery Project
A ‘stretch goal’ for the year was to investigate the possibility of providing open data on all representatives. We aimed to learn about the technical feasibility, the user needs and whether a sustainable income could be identified to pay for its upkeep.
We spent a week focusing on the issue and wrote a series of blog posts on the technical and sustainability challenges.
In short: producing open, structured data on our political representatives seems technically feasible without a great deal of work: perhaps costing just £100,000/yr. There are users ready and waiting for this data, notably campaign organisations who would like to mobilise their supporters to engage with their representatives.
There was no immediate sign of a source of revenue that would warrant an attempt to begin a full representatives data project, but we hope to continue conversations about this subject with interested parties in future.
The Year in the Club
Members and Volunteers
Members
Currently, we count anyone on the mailing list as a member. This year passed 20,000 mailing list subscribers and we have 5,000 twitter followers and 1,000 Facebook followers. We hope to survey members and measure engagement more deeply this year.
Live events
We ran crowdsourcing parties (‘SoPN parties’ — for the Statements of Persons Nominated before an election) in the run up to the local elections, as in previous years. For the first time, we crowdsourced the running of these events, with volunteers stepping up to host. As a result, volunteers and staff hosted events in Bath, Belfast, Birmingham, Cambridge, Huddersfield, London and Stroud. Attendance was small, particularly in the smaller cities and towns that hosted, but served to both bring on board new volunteers and conduct valuable user testing of the crowdsourcing website.
Online volunteers
This year, 1,218 volunteers contributed data via 97,548 edits to the candidates database. This mostly involves adding data for the scheduled elections, but there is a small group of volunteers that ensures all by-elections are covered. Of the total, 896 volunteers were new this year and they collectively made 32,656 edits.
Our Slack group has now been joined by 400 members, with perhaps 50 people regularly contributing to ask or answer questions about democratic process or elements of our technology.
Finance and Governance
Finance
Our financial year runs from March to March. See our latest return via Companies House. During the last election year, we secured new funding from Garvin Brown and the Joseph Rowntree Charitable Trust, as well as continued support from Unbound Philanthropy and via selling services to The Electoral Commission.
Funding policy
This year, we developed a funding policy and a record of all previous donations over £5,000.
Small donors
In an effort to grow the number of small, regular donors, which we have traditionally seen as the most secure and democratic form of funding, we added a donation request to every result page of WhoCanIVoteFor.co.uk and WhereDoIVote.co.uk for the local and European elections. Hundreds of thousands of people will have seen this donation form and we tested different versions of the message, but none resulted in any significant click-through rate, and overall the project generated just two new regular donors, one from each of Who and Where. This lack of clicks and donations may relate to the short amount of time that a user uses the site or the belief that this information is or should be provided by the public sector. We’ll continue to think about small-donor fundraising in future, perhaps in the form of a crowdfunder for any unscheduled election.
Governance
The board continues to meet quarterly to review finance and strategy. An away-day in September 2018 helped produce the new vision and mission statement above. There were no changes to the membership of the board during this election year.
What’s Next?
Goals for the Next Election Year
We believe digital information on elections is likely to lead to outcomes such as a sustainable increase in:
- meeting civic expectations of access to information on the democratic process;
- number of citizens informed about elections and the democratic process,
- engagement with candidates or the elections process,
- engagement by groups normally less likely to take part in democratic process,
- turnout at elections, and
- trust in democracy.
These outcomes are broad and not yet all measured, nor can we clearly attribute our own work to any change in them, but they serve as useful indicators of our purpose.
Our goals for the election year 2019-2020 are as follows. This assumes funding remains at a similar level to last year.
- 1.5m people reached with voter information for 2020 local / mayoral / Police and Crime Commissioner (PCC) elections
- 10m people reached with voter information in the event of a snap general election or nationwide referendum
- 100% coverage of elections and basic candidate information for all by-elections and scheduled elections through May 2020
- 90% coverage of polling location data for the electorate with scheduled local elections in May 2020
- At least one new consumer of our by-election data
- Five-point rise in % of candidates for whom we have information beyond name and party affiliation
- Five-point rise in satisfaction on WhoCanIVoteFor.co.uk
- Our websites meet new accessibility requirements
- Our websites function and remain secure
- We provide better opportunities for club members
- We better understand the user needs of underrepresented audiences
- A statement is made by an institution of the UK state, which confirms that it plans to take on some election data provision
You can view our outcomes, goals and inputs for 2019-2020 in this matrix and we welcome feedback.
We have further plans ready to implement in the event we can secure significant additional funding over the next year.
Acknowledgements
As always, none of this would be possible without the volunteers of Democracy Club who spend thousands of hours adding, checking and cleaning data, or who help maintain our systems through their advice and expertise.
Thanks to the board for assisting with finance and governance, and thanks to our donors: Unbound Philanthropy, the Joseph Rowntree Charitable Foundation and Garvin Brown.
Thanks also to The Electoral Commission and local governments for their expertise, help and support.
How to Help
Want to help build a better democracy? Get news and requests via our our mailing list at democracyclub.org.uk.
For more day-to-day chatter and calls for help, join our Slack.
Join the open Google Group to start your own email discussions.
And of course, if you are able, please also support our work with a monthly donation.
Humber bridge photo credit: darrenflinders