2024 local and general elections
This report provides an overview of Democracy Club’s work before and during the 2024 local and general elections.
Summary
- We collected polling station data for every council in both polls. The general election was the first time we’ve had data from every single UK council at the same time.
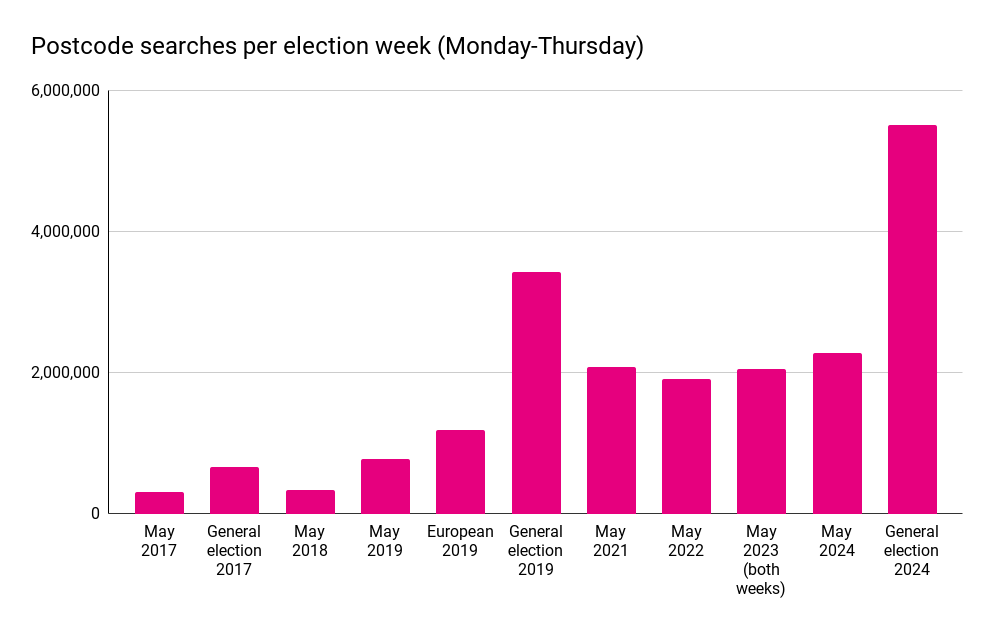
- Our elections database processed 20 million postcode searches from the UK public between 1 April and 4 July. The week of the general election saw two million more searches than the comparable period in 2019.
- Our tools were promoted by 59% of local authorities as part of their election communications to voters.
- Our volunteers gathered a wealth of candidate information for both elections, including a photograph for 95% of general election candidates.
- We used Who Can I Vote (WCIVF) For to give voters information about parliamentary boundary changes for the first time.
- We launched a new ‘your area’ lookup on WCIVF immediately after polling day. In partnership with the Welsh Government, we piloted polling station accessibility information for the PCC elections on Where Do I Vote.
- WCIVF received record user satisfaction for both elections, reaching 86% in general election polling week.
- Our partnership with the Electoral Commission continued for another year, allowing us to scale our impact.
- Worked with the BBC and the Electoral Commission to deliver our elections data on the BBC News website.
- Our candidate data was used widely throughout the general election period, including by election prediction websites YouGov, Financial Times and Electoral Calculus.
- Had a jolly nice time, all things considered.
Elections overview
On 2 May 2024, local, mayoral and Police and Crime Commissioner elections were held in England and Wales. This was followed by a parliamentary general election, which was announced on 22 May and held on 4 July.
The local elections ran very smoothly. We completed our polling station data collection earlier than ever, and were able to spend considerable time enhancing our candidates database and Who Can I Vote For.
The timing of the unexpected general election announcement presented both challenges and benefits for us. It caught us somewhat unawares - our lead polling station developer was in the Outer Hebrides - and the polling station data collection process was complicated by the timescale and the way in which constituencies which cross council boundaries have to be handled. On the other hand, the local elections gave us an excellent launchpad. We were able to retain the contract developers we had hired to work on the locals, and they ensured that we did not fall behind in the crucial first days of the campaign. We had previously prepared a comprehensive general election plan, and our volunteers had been building a list of prospective parliamentary candidates since July 2023. Thus we were able to create the election and added the pre-existing candidates within an hour of the announcement, and we experienced no major issues during the campaign.
The year in data
Candidate database improvements
Over the summer of 2023 we made important changes to the data we collect and publish on election candidates. We launched a new CSV generator for exporting data on candidates, added turnout and other electoral data to Who Can I Vote For (WCIVF), and introduced the concept of deselected candidates. Read more about these changes on our blog.
Elections data and boundary changes
In the year following the 2023 local elections we took time to think about how we handle boundary and other changes, both for council and parliamentary elections. In addition to the usual local government boundary changes, these elections saw new parliamentary boundaries, and some last-minute changes to mayors and Police and Crime Commissioners. Changes can be difficult for us; while our system has become more flexible in recent years, UK electoral law is a perpetually shifting landscape which needs constant attention. Local government boundaries are a constant challenge, as they are often put into law quite late in the day and are not actually published until after the first election in which they are used, meaning that we need to map them ourselves.
Of the 107 councils holding elections in May, 21 had boundary changes. In February, we published an Electoral Changes Order Tracker, which allows users to view the latest boundaries for each council area. This has laid the groundwork for a more comprehensive solution to the problem which we plan to implement in the near future.
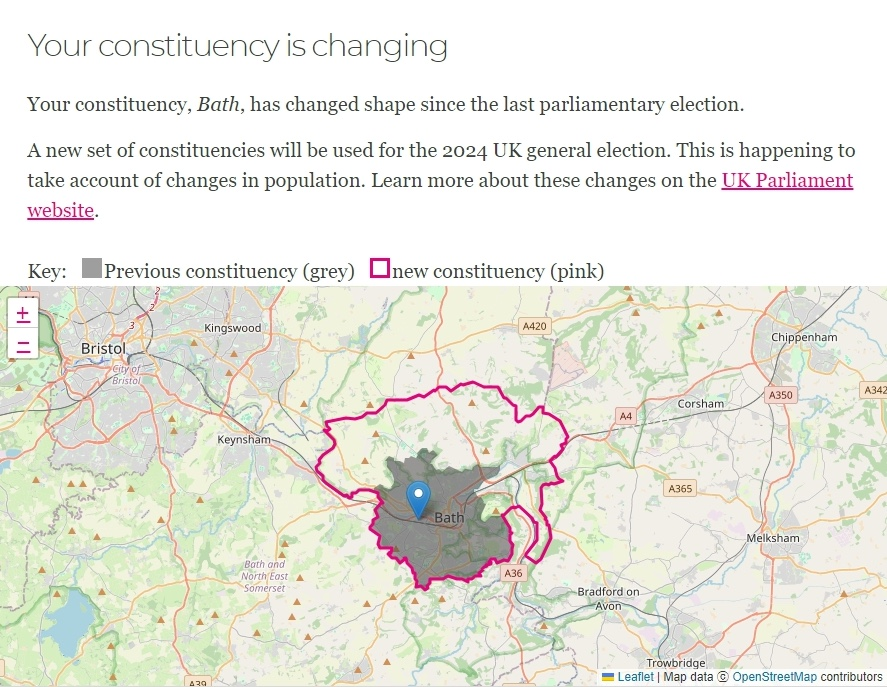
90% of parliamentary constituencies saw their boundaries change as a consequence of the recent boundary review. We were able to add maps to WCIVF to tell users about their new boundaries. We received excellent feedback on this feature, as well as on the overall accuracy of our boundary data, from both voters and partners. Building on this experience, we will be exploring the possibility of adding maps and details about boundary changes to council elections in the future.
Data Collection
Polling Stations
The general election marked the first time that we had collected polling station data for every single council in the UK, a major organisational milestone and well up on the 73% achieved for the 2019 general election. We also collected polling station data from every council in England and Wales for the May PCC elections. We’re extremely grateful for the communications support we received from the Electoral Commission and Association of Electoral Administrators towards this.
Of 355 electoral services teams in GB, 353 of them provided an export from their Electoral Management System (EMS), with the remaining two providing an API for different reasons. We also received data from the Electoral Office for Northern Ireland. In some ways, our work is becoming easier, as council mergers have reduced the number of electoral services teams we need to work with, down from 382 in the 2017 general election.
During the May elections we conducted a pilot for the Welsh Government, using the polling station finder to provide more detailed accessibility information to voters, such as whether a station had parking or ramp access. This was a significant success. We consulted with a number of councils to understand what information they held and how we might collect and publish it. We also spoke with EMS suppliers to devise a means of allowing this experiment to be rolled out more widely. In the end, we were able to provide accessibility information for over 600 individual polling places for the May elections.
Collecting data for the general election posed unique challenges caused by cross-boundary areas, with many councils ‘taking on’ polling stations from their neighbours. Since each area handled this differently and many electoral services teams were encountering this issue for the first time due to boundary changes, we mapped and verified the data ourselves to identify and resolve any gaps. Despite handling a record number of both stations and users, we were delighted with the very low number of bug reports and issues with the data (incorrect postcodes, map points, etc), something we ascribe in part to our work over the last few years in helping councils to improve the accuracy of their data. Electoral services provided 46% of polling places with location data (a coordinate or Unique Property Reference Number), which meant that we were able to present a map to users of Where Do I Vote (WDIV).
| Nation | Number of unique polling places | With maps |
|---|---|---|
| England | 25,933 | 48.16% |
| Northern Ireland | 596 | 100% |
| Scotland | 2,195 | 26.65% |
| Wales | 2,129 | 22.83% |
| All UK | 30,853 | 45.88% |
Candidates
The deadline for nominations for the May elections fell on Friday 5 April, which meant that councils had until Monday 8 April to publish their Statement of Persons Nominated (SoPN). In the event, roughly half of the SoPNs were published on the Friday and half on the Monday. Our volunteers had finished data collection by 9 April. With a relatively small number of councils to cover and our polling station work proceeding very quickly, we took some time to expand the party political information displayed on Who Can I Vote For. Across the 107 councils holding elections we collected 98 local manifestos and other policy documents.
We began building a database of prospective parliamentary candidates (PPCs) in July 2023, and launched this as a public-facing page on WCIVF in December. This allowed us to pre-populate our database with 2,500 candidates immediately on 22 May.
Nominations to stand in the general election were published on 7 June, and we had a complete database by 1am the following morning. This contained a couple of errors which we ironed out by 9 June, but in the future we will take better care to compare our data with other publicly published datasets to spot these faster.
The general election saw a record number of candidates. In the months before the announcement we had reached out to all major GB political parties, and received files of candidate data from Labour and the Green Party of England and Wales. We also emailed every local party and individual candidate we had an email address for, the latter with direct links to login and edit their candidate profiles. 7,250 new users signed up to our candidates site over the election period. We were especially pleased to see a number of high-profile MPs and candidates either signed up or emailed us directly to add information to their profiles.
This, combined with the fantastic work of our volunteers, meant that by polling day we had a photo for 95% candidates, an email address for 82.4%, at least one weblink for 88.5% a statement to voters for 53.6% and a Wikipedia page for 15.6%. We also collected manifestos for 40+ political parties. This was shown on Who Can I Vote For, allowing users quick access to policy information at the same place as information on candidates in their area.
To eliminate the risk of vandalism during the busiest period, we blocked all new account creation during the week of the election. Over the course of the election we saw very little attempted vandalism.
We took the opportunity to produce some deep dives into our data for both the local and general elections.
The core team and dozens of volunteers stayed up during the night to collect election results data for the general election - we presented a map on the front page of WCIVF and highlighted the profiles of winning candidates underneath.
Reach and impact
Between 1 April and 4 July our elections database processed 20 million postcode searches from the UK public.
Both elections brought us record search figures during the final week (Monday-Thursday). The local elections saw 2,285,279 searches (from 29 April to the close of poll on 2 May), a record for a local/devolved election. The general election saw a record of 14,467,228 searches (from 22 May to the close of polls on 4 July).
In addition to our ongoing partnership with the Electoral Commission (20% of election week searches) and BBC News (12%), mySociety also used our API on They Work For You, generating over 2 million searches across the election and 9% of general election week searches. The Labour Party also remains a customer of our API, generating 14% of our election week searches, although considerably fewer than mySociety or the BBC over the whole election period.
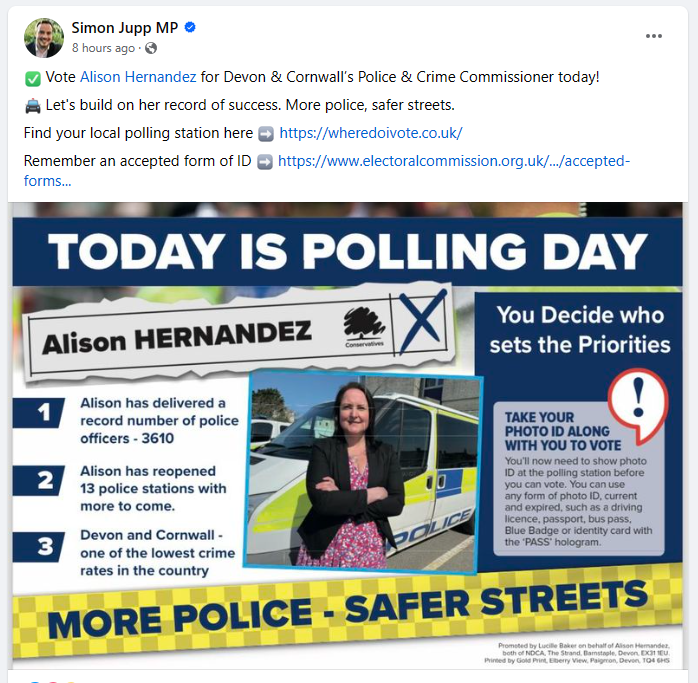
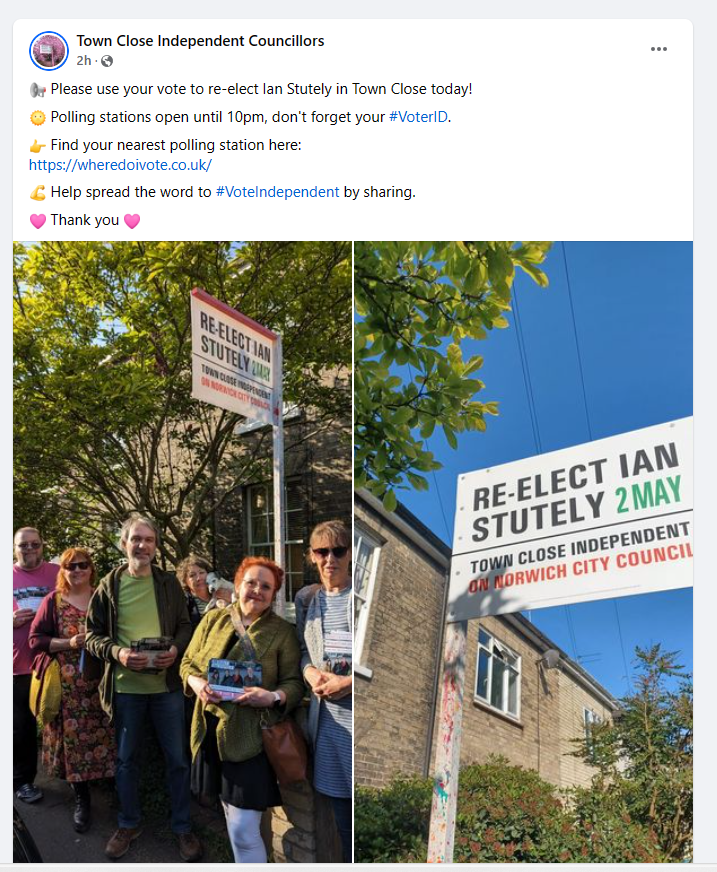
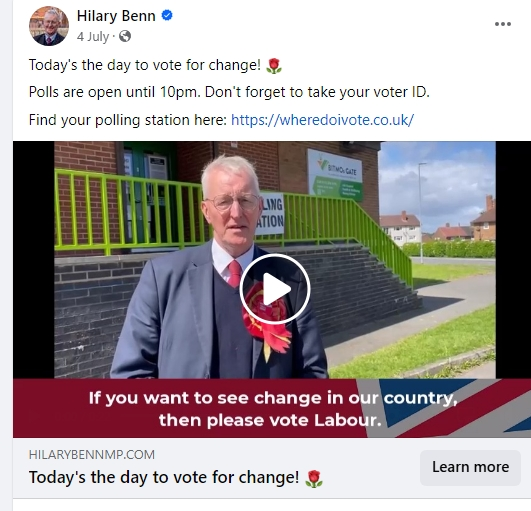
We were especially delighted with the traffic received by WCIVF and WDIV, which between them generated over six million searches during the general election period. For WCIVF this represents only the minimum impact, as a large number of visitors navigated the site without entering a postcode. Our analytics suggests that the site received around 20 million individual visits across April and June. The Richmond and Northallerton constituency page received approximately 17,000 visits directly from Google, for example. WDIV was once again shared on social media by politicians from all political parties and none.
Where Do I Vote shared by politicians from across the political spectrum.

WCIVF was promoted by the radio stations Nation Radio and Times Radio, who both used it to give their listeners the full list of candidates in each constituency following interviews with candidates.
The sites were used in campaigns by organisations as varied as the Vegan Society, Right to Life, Republic, the Catholic Union, and the National Secular Society. Other examples included a range of groups supporting ethnic minorities, such as for instance, both Turkish and Greek Cypriot groups.
We are also very happy with the continued uptake of our interactive ‘widget’, which anyone can embed into their own website either in our own branding or that of the Electoral Commission. This was used by dozens of smaller new sites, charities and campaigns, 30 universities and student unions (including a large NUS email campaign), and added to the websites of the Liberal Democrats and Plaid Cymru.
Council users
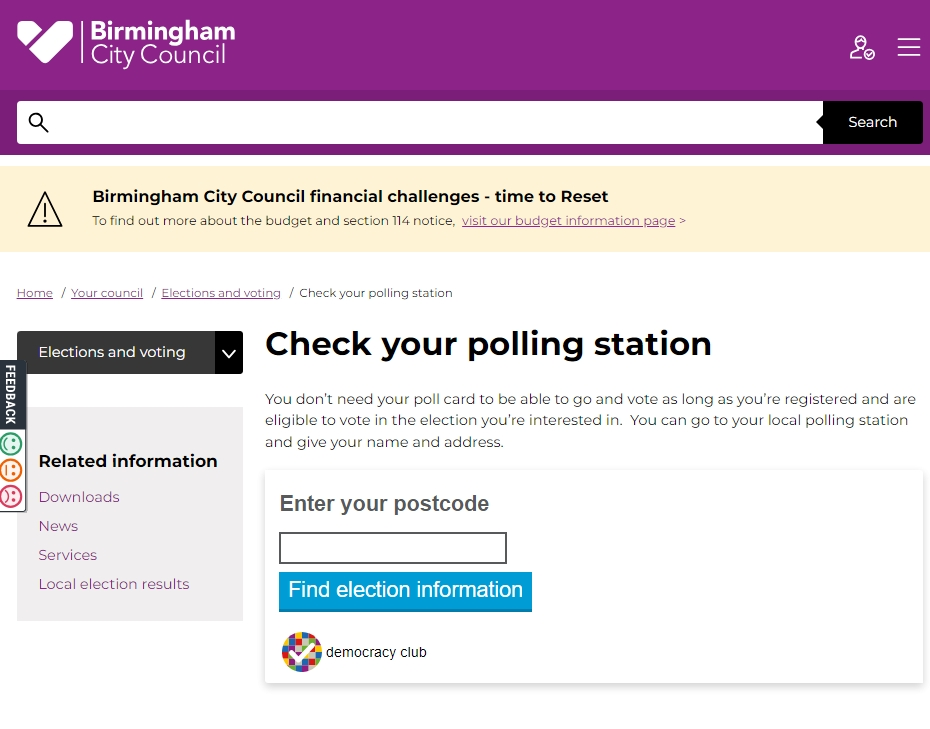
Democracy Club’s presence on local authority websites continues to increase. 219 (59%) principal GB councils embedded our widget or promoted one (or both) of our sites to voters during 2024. We’re particularly pleased about widget takeup - 96 local authorities added it to their website, up from 78 in 2023. WDIV remained the most popular site for councils to link to (149 links), but WCIVF(63 links) is also achieving greater acceptance. There can be no better indication of the trustworthiness of our services than this metric; for the first time, we are a core part of the public communications of the majority of local authorities.
Our sites were also promoted by 27 town and parish councils, the Scottish boundary commission, and (as in 2019) the UK parliament general elections page.
Candidates data users
Local elections
Once again BBC News made use of our candidates data to run a lookup on its website for the local elections. For internal reasons they built their own list for the general election, but checked it using ours and continued to use our elections data to run their lookup.
During the local elections we again worked with the Fawcett Society to produce gender estimates for council, mayor and PCC candidates, a story picked up by the Local Government Chronicle.
General election
For most of the pre-election period we were the only organisation with an open list of announced general election candidates, and we saw a very high level of interest in our data from prominent journalists and political accounts on social media.
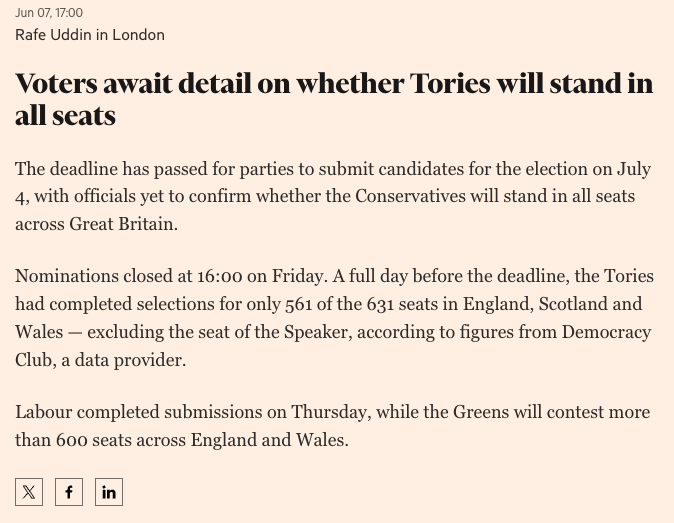
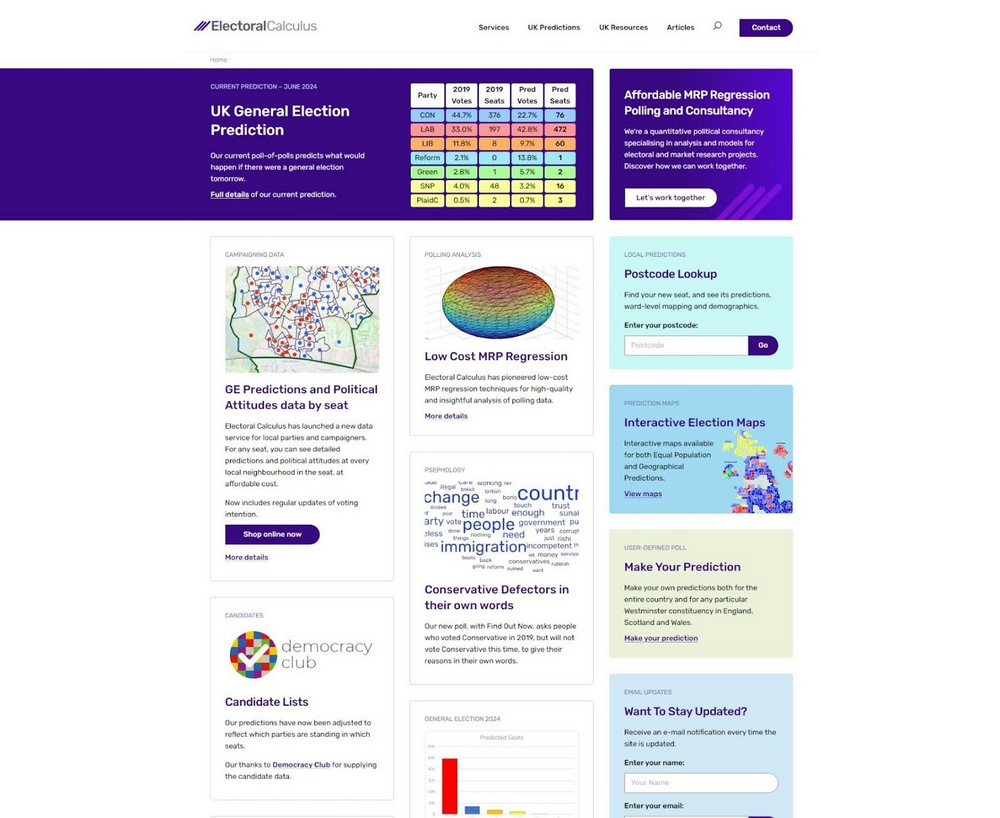
Following close of nominations, our open database of election candidates was used by a large array of organisations during the general election, including election predictor sites run by the Financial Times, YouGov, and Electoral Calculus, who valued not only the accuracy but also speed with which we were able to put it together.
Our summary blog on the general election candidates received 40,000 views during the campaign period, roughly 40% of our overall company site visits for the entire year.
Our general candidates database was used widely among journalists, academics and others, And inspired stories and articles from UK and EU, Byline Times, and Sky News. The latter was part of a partnership with Sofia Collignon, senior lecturer in Comparative Politics at Queen Mary University of London, who also used our database to survey election candidates on their experiences during the campaign.
We started the year hoping for a new, large partnership and held meetings with major U.S. tech companies. While we gained insights into their decision-making, the talks did not secure funding.
We found multiple factors stood in the way of these companies producing a bespoke response to the UK election. Foremost was the fact that the UK was usually pushed into the ‘rest of world’ category. This meant that other other important polls in this record election year (EU, India, South Africa, US) were prioritised at the expense of the UK.
We had approached them well in advance and offered a suite of tools which would allow them to deploy comprehensive information as soon as the election was announced. The fact that the UK wasn’t even on Meta’s (Nick Clegg-authored!) list of elections to prepare for is indicative of their priorities. While we don’t expect them to pay as much attention to the UK as, say, the US, it is disappointing to reflect that these multi-billion dollar companies were unable to set election strategies for all national elections, given the globally pervasive reach of their products.
The unknown date was a factor (‘come back in October’ was a common reply), however even without a date more could have been done by larger companies to be ready for an announcement. Where resources were made available to the UK, they were generally pushed towards voter registration rather than engagement.
With much talk about AI at the moment, Microsoft Bing was the only company to use our data to try to prevent their tools being misused in a way that might compromise the election in some way. They did this by teaching the AI who the candidates were and prevented it from generating material for them.
Feedback
User satisfaction on Who Can I Vote For and Where Do I Vote was extremely positive across both elections. A total of 12,842 feedback responses were received for the local (5,613) and general (7,229) election weeks combined. Detailed analysis, including feedbacks for the entire election period, can be found in the respective blogs: local election | general election.
User satisfaction
Who Can I Vote For saw its highest user satisfaction to date in both elections, reaching 86% in July, an increase of 33% over the 2019 general election. The greater information coverage on candidates aligned with the increase in user satisfaction, highlighting the importance well-sourced candidate material has on an users’ experience on Who Can I Vote For.
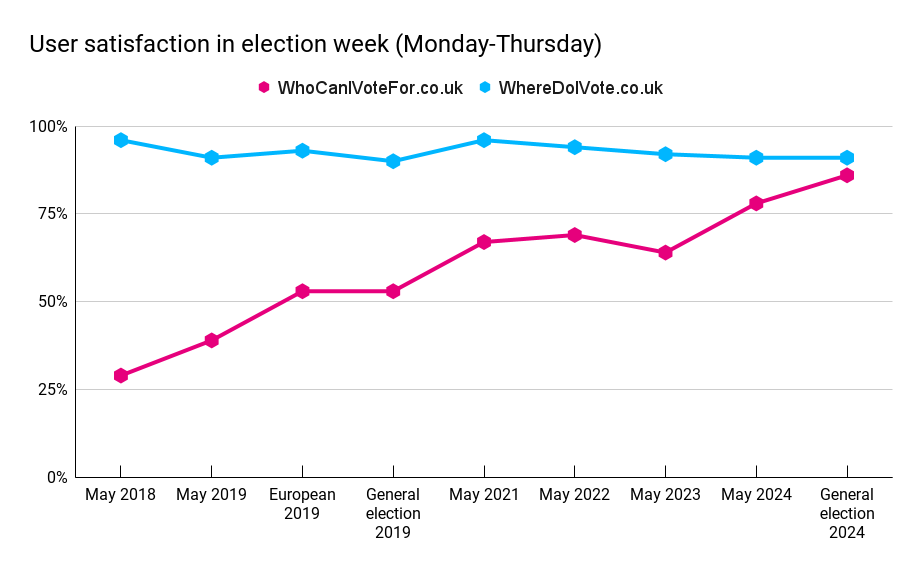
Each election we ask visitors to our sites two questions: ‘Did you find what you were looking for’ and ‘Has this information made you more likely to vote?’ - as well as a written feedback opportunity. Across both elections, ‘yes’ was the most popular response to ‘Did you find what you were looking for’. In regard to voting intention, users on WCIVF were provided with the following options: ‘less likely’, ‘more likely’ and ‘no difference’, users on WDIV were provided with ‘yes’ and ‘no’. The most common response on WCIVF across both elections was ‘no difference’, with 68% selecting this response during the general election and 50% respondents in the local elections selecting ‘no change’.
‘Did you find what you were looking for?’
| Who Can I vote For | % | Where Do I Vote | % | |
|---|---|---|---|---|
| General Election | 3,410 | 86.16% | 3,358 | 93% |
| Local Elections | 2,862 | 78.16% | 1,606 | 91% |
‘Has this service changed your likelihood of voting?’
| Who Can I vote For | % | Where Do I Vote | % | |
|---|---|---|---|---|
| General Election | 682 | 22% | 2,919 | 78% |
| Local Elections | 1,065 | 33% | 1,237 | 80% |
Launching a representatives lookup
Shortly after close of polls in the general election, we launched a new lookup for WCIVF. Under the working title of ‘your area’, this uses our elections geographies and results database to give users information about the different layers of elected representatives which exist in their postcode.
This lookup is the first public outing of our representatives project, funded by the Joseph Rowntree Charitable Trust over two years from 2022. We hope to use it as a springboard into future partnership with other organisations in this space, such as mySociety and the Politics Project. Learn more about this new departure on our blog.
Organisational developments
Electoral Commission partnership
We run two services for The Electoral Commission; the part of their website that performs postcode lookups, and a version of our main postcode lookup API. We work closely with the Commission’s digital communications team to maintain and develop these.
This year we agreed that the postcode lookup needed a design refresh. This was both so that the general election information was easier to understand, but also to ensure that all of the many scenarios we see around all elections work well for all users.
For example, we previously had a single hierarchy of information about elections that included information about registering to vote. Because we know when the deadline has passed, we were able to change the design to tell people that the deadline had passed for and de-priorities the content. We managed to apply this dynamic prioritisation so we show different layouts depending on the stage of the election timetable.
We hope to use some of this dynamic layout in our other projects.
The Commission continues to be our largest funder and our partnership is getting stronger over time. We would like to thank them for all they have done in helping us with polling station coverage in the last year.
Communications
We spent quite a bit of 2023 thinking about our external communications. We modified the messaging on our company website (that is, this one), and added a page of case studies to highlight some of the partnerships we’re most proud of. In October 2023 we moved to self-host our mailing list using ListMonk, and have committed to a monthly newsletter. All past newsletters are now available in an archive. Our mailing list currently stands at 35,000 email addresses. Read more about these developments here. We also took some time to produce a few more in-depth blogs, in part to better demonstrate where our expertise lies. These included topics such as Welsh and Scottish electoral reforms, candidate statements, and voter information.
Leaflets
In April we were awarded a grant by the Joseph Rowntree Reform Trust to completely revamp ElectionLeaflets.org ahead of the general election, and we had planned a partnership with Full Fact and others. Unfortunately the election was announced too soon for this work to be started. JRRT have kindly confirmed that we can use the money to work on the site in time for the 2025 local elections, and at the moment, we are reaching out to more potential partners.
Organisational funding
Democracy Club is now financially independent of charitable grant funding, following confirmation of increased funding from the Electoral Commission, as well as other recent sales income from the Welsh Government, London Elects and others. We’d like to extend a special thanks to the Joseph Rowntree Charitable Trust, whose funding over the last few years has brought us to this position.
What’s next
Our immediate priority will be to complete the JRRT-funded Election Leaflets project, which we hope to finish by January. We’re already starting to plan for the 2025 local elections, which are scheduled for 1 May (mainly English county councils). We’ll also be focusing on improvements to the candidates database which were raised during the general election, as well as our elected representatives lookup, which we launched last month. Last but not least, we’re working on a data project relating to parish councils with the National Association of Local Councils.
We have projects in the works with each of the UK’s devolved governments as well as some other exciting partnerships in the works. Watch this space for more on them as they develop over the year.
Thanks
As always, we couldn’t have done this alone. We want to thank our amazing volunteers, the Electoral Commission, the Association of Electoral Administrators, the Electoral Office for Northern Ireland, and electoral services teams across the UK - Democracy Club simply wouldn’t exist without your contributions!